Logging your AI events (from Ollama) in Bronto
David Tracey
Many software companies, including logging platform providers, are investigating the use of Large Language Models (LLMs) in their products and some have embedded LLMs in their application. For our part Bronto has announced our Bronto Labs initiative and the first three areas where we will introduce AI into our logging platform in order to reduce user toil, increase team efficiency and reduce MTTR include:
- Auto-Parsing logs using AI
- AI Dashboard Creation
- BrontoScope to investigate particular errors
This post will, however, consider a different aspect of logging and AI - using logs themselves in developing AI applications or even LLMs. We will focus on Ollama, but in subsequent posts we will look at other LLMs and use cases in logging.
Ollama ( https://ollama.com/) is an open source tool that enables the execution of large language models ( LLMs), where the model can be chosen by the user from a wide variety on the Ollama Registry. Ollama can be run locally with reasonable performance, with or without GPU support, but the size of the model and the RAM on your machine may affect the performance, i.e. smaller models can be expected to run more quickly.
LLMs are complex systems, but as well as “traditional” use cases for logging, like performance and latency monitoring/evaluation or API usage, their non-deterministic nature increases the need for logging, e.g. in being able to record and track/analyse responses to prompts.
Hence, it is important to note that tools and services such as Ollama and Bedrock can produce lots of logs. The size of each individual log event can be large for those logs that include a prompt or the response, as the prompt itself or the response can be large. Furthermore, it is these log events containing the prompt and response that may be important to an application developer who wants to debug or even provide an audit for his application.
Meta considered the problem of logging AI events at their scale to require the development of a dedicated Meta AI Logging Engine for internal use and they state “In order to triage such a dynamic nature of failures, it is necessary to collect detailed telemetry on the systems and model telemetry”.
So, without considering use cases in detail, we can say that the following are fundamental requirements for a logging solution for AI applications:
- Ability to handle large log events
- Ability to handle high volumes of log events at low cost
- Ability to search across a high volume of events
Fortunately, these are the requirements Bronto was designed to meet. An earlier blog Why is Bronto so Fast showed how fast Bronto can search large volumes of logs and The Log Management Cost Trap - Storage showed how we provide high volume, low cost log storage.
An additional requirement is also emerging in the logging of AI systems and that is the ability to debug across multiple, distributed agents and this is a perfect requirement for a SaaS solution that centralises logs like Bronto to meet. Furthermore, there is a growing realisation of the need to generate and retain audit records for certain AI applications, which suits Bronto’s 12 month default retention policy.
We’ll begin by installing Ollama, then see how easy it is to set up Ollama to send logs to Bronto.
Next we’ll write a simple API program to make requests to Ollama and to view/search the logs in Bronto. More detail on debugging Ollama can be found at Troubleshooting Ollama, where it states “One of the best ways to figure out what happened is to take a look at the logs.”
Setting up Ollama
The following are recommended to run Ollama:
- 16GB RAM for running models (it will run on 8GB for some smaller models)
- 12 GB disk space for Ollama and basic models. Additional space will be needed to store model data according to the model
- A modern CPU with at least 4 cores, with 8 preferred
- Optionally a Graphics Processing Unit (GPU) to improve performance, particularly with large models
Install and run Server
Install Ollama from https://ollama.com/download for your OS, and follow the instructions. Once installed, run the server by entering “ ollama serve” on the command line to launch the Ollama server. You should see something like the following subset of output produced (and note the default port it is listening on):
% ollama serve
time=2025-07-07T15:51:58.972+01:00 level=INFO source=images.go:754 msg="total blobs: 20"
Download a model
The pull command is used to download a model to use from the Ollama model registry, e.g.
ollama pull gemma:2b
The list command is used to show the list of models on your local machine, e.g.
ollama list
NAME ID SIZE MODIFIED
mistral:latest f974a74358d6 4.1 GB 5 weeks ago
gemma:2b b50d6c999e59 1.7 GB 8 weeks ago
llama3:latest 365c0bd3c000 4.7 GB 2 months ago
llama3.1:latest 42182419e950 4.7 GB 3 months ago
The run command is used to run a model on your local machine, e.g
ollama run gemma:2b
This displays a >>> prompt on your terminal and you can then enter a prompt or /? for help
Available Commands:
/set Set session variables
/show Show model information
/load <model> Load a session or model
/save <model> Save your current session
/clear Clear session context
/bye Exit
/?, /help Help for a command
/? shortcuts Help for keyboard shortcuts
Use """ to begin a multi-line message.
Sending Ollama Logs to Bronto
Now we will walk through how to set up Ollama logging and how to use OpenTelemetry to send logs to Bronto.
Set up logging for Ollama
-
Firstly, stop the ollama server started in an earlier step and restart it this time to write the server logs to file (default is to go to the console) as below (adjusting the path to suit from the default of ~/.ollama/logs/server.log), e.g.
- ollama serve > /your_log_path/.ollama/logs/server.log 2>&1
-
Secondly, to get more detailed Ollama logs, you can update the logging level for Ollama to debug if you want to get a richer view of what Ollama is doing. In .zprofile (or wherever your profile is)
export OLLAMA_LOG_LEVEL=DEBUG
export OLLAMA_DEBUG=true -
export OLLAMA_LOG_LEVEL=DEBUG
-
Next, you can also redirect logs from a client running a model to stderr by
- ollama run gemma:2b 2>>/your_log_path/.ollama/logs/gemma.log
Or to redirect both stdout and stderr, do as below, but note this means we lose the ability to input and see responses on the console (so this is only useful if you are going to use the API to send prompts and not the console)
ollama run gemma:2b > /your_log_path/.ollama/logs/gemma.log 2>&1
- Check that ollama logs are being created locally, e.g. using tail
tail -f /your_log_path/.ollama/logs/server.log
Set up OpenTelemetry
Bronto supports the use of the OpenTelemetry Collector to send us logs as per our docs page at Send Logs to Bronto. This is a suitable method to use for sending Ollama logs and while Ollama does not come with a native Open Telemetry integration, it can be set up for Ollama as shown in the following sections.
There are also client side tools such as OpenLIT and Langfuse that can instrument your application and you can configure an OpenTelemetry Protocol (OTLP) endpoint to send their data to an external platform, such as Bronto. Future blogs will consider the use of these tools.
Download and Install OpenTelemetry Collector
-
Download and install per OpenTelemetry Install, for your hardware and operating system. As an example, the following download and install is for the OpenTelemetry version for a Mac running the Darwin OS on ARM64:
> curl --proto '=https' --tlsv1.2 -fOL https://github.com/open-telemetry/opentelemetry-collector-releases/releases/download/v0.114.0/otelcol-contrib_0.114.0_darwin_arm64.tar.gz
> chmod +x otelcol-contrib
> mv otelcol-contrib /usr/local/bin/otelcol
Verify your OpenTelemetry Collector
> otelcol --version
-
Create a dir and config file if it was not created by install
- mkdir /etc/otelcol/config.yaml
Forward Logs to Bronto
Once you have completed your OpenTelemetry install as above, you can send logs to Bronto, per the following steps
- Create a config.yaml to forward the Ollama logs to Bronto, which will be similar to the following (with paths adjusted as needed, such as renaming items with Gemma if using a different model)
filelog/Ollama_Server:
include:
- /your_log_path/.ollama/logs/server.log
resource:
service.name: LaptopServer
service.namespace: Ollama
filelog/Ollama_Gemma:
include:
- /your_log_path/.ollama/logs/gemma.log
resource:
service.name: LaptopGemma
service.namespace: Ollama
processors:
batch:
exporters:
otlphttp/brontobytes:
logs_endpoint: "https://ingestion.us.bronto.io/v1/logs"
compression: none
headers:
x-bronto-api-key: replace_this_with_your_bronto_apikey
service:
pipelines:
logs:
receivers: [filelog/Ollama_Server, filelog/Ollama_Gemma]
processors: [batch]
exporters: [otlphttp/brontobytes]
# Useful for debugging
# telemetry:
# logs:
# level: "debug"
# output_paths: [/your_log_path/otelcol/debug.log]
- Validate your config.yaml
otelcol validate --config=/etc/otelcol/config.yaml
- Run OpenTelemetry
otelcol --config=/etc/otelcol/config.yaml
A Simple Ollama API program
The python code for this API program ollama-log-demo.py is in the Appendix. It uses the Ollama API, which allows users to make requests to models and generate a series of responses and this program:
-
Retrieves log events from a specified log file.
- This file was downloaded from a Bronto CDN log. If you have a Bronto account, you could extend this program to use the Bronto Search API to retrieve selected log events from Bronto and then analyse those logs using Ollama.
-
Allows you to make requests with different prompts on the specified log file using the model specified in the command line argument “--model”, shown below for the gemma:2b model
-
The first prompt asks Ollama to produce a summary of the logs
python3 ollama-log-demo.py 100lines-CDN-log.csv --model "gemma:2b" --prompt "You have been given 100 lines from a CDN log in CSV format. Summarise the logs provided."\n
-
The second prompt asks Ollama to find errors in the logs
python ollama-log-demo.py 100lines-search-log.csv --model "gemma:2b" --prompt "Find errors in this log and suggest how to fix them"\n
-
The functionality of the second prompt is a simple example of the richer functionality built into BrontoScope, mentioned at the beginning of this blog, which runs in the Cloud and not locally as in this example.
The final part of the response from Ollama also includes additional data gathered when generating the responses (and these can also be found in the server logs)
| Field | Description |
|---|---|
| total_duration | Time spent generating the response |
| load_duration | Time spent in nanoseconds loading the model |
| prompt_eval_count | Number of tokens in the prompt |
| prompt_eval_duration | Time spent in nanoseconds evaluating the prompt |
| eval_count | Number of tokens in the response |
| eval_duration | Time in nanoseconds spent generating the response |
| context | An encoding of the conversation used in this response; can be sent in the next request to keep memory |
| response | Empty if streamed; contains full response if not streamed |
Example Response from API program
The following is an example of a response to the first prompt above requesting a summary of the CDN Logs.
**Here's a breakdown of the key points:**
* **Timestamp:** Each entry contains a timestamp indicating the date and time of the request.
* **Client IP:** The client IP address is different for each request, suggesting different devices or applications making the requests.
* **Location:** The location is specified based on the country and city (e.g., Italy, Chula Vista).
* **Request Method:** The request method is indicated for each request.
* **Response Status Code:** The response status code indicates the result of the request.
* **Response Body Size:** The size of the response body is provided in some cases.
* **API Key:** The API key is also included in some requests, indicating the authorized access.
* **Fastly Server:** The fastly server field indicates the server used for the request.
You can try different models such as mistral or llama3.1 with the program and compare the time taken and the detail of the response given. These modelsGemma:2b is good for summarising, but tends to give summaries rather than what the prompt asked for, even when specifically told not to give a summary. Mistral takes longer to create responses and they tend to be more detailed and specific to the data, but it can also tend to provide summaries - defining the prompt for your use case is key.
Searching Ollama logs in Bronto
The Ollama server sends
-
“traditional” log messages according to the levels [INFO] for normal operation messages, [WARN] for non-critical issues and [ERROR] for errors requiring attention, for example
- INFO [main] HTTP server listening | hostname="127.0.0.1" n_threads_http="7" port="5 Jul 09 12:00:24.921
- level=INFO source=sched.go:714 msg="new model will fit in available VRAM in single GPU, loading" model=/Us7814" tid="0x201604c00" timestamp=1752058824
- time=2025-07-10T10:46:17.593+01:00 level=INFO source=server.go:105 msg="system memory" total="8.0 GiB" free="1.2 GiB" free_swap="0 B Jul 10 10:46:18.471"
- level=DEBUG source=memory.go:103 msg=evaluating library=metal gpu_count=1 available="[5.3 GiB]"
-
log messages containing a variety of information such as log events that contain “model” or “memory” or GPU that allow you to see how the model loaded, its resource usage or if it failed due to the lack of some resource like memory, for example
- “llm_load_print_meta: max token length = 93”
- “llama_model_loader: - kv 0: general.architecture str = gemma”
- “time=2025-07-10T10:46:17.593+01:00 level=INFO source=sched.go:714 msg="new model will fit in available VRAM in single GPU, loading" model=/Users/…..””
It is worth noting that the log lines above are unstructured or semi-structured, meaning that the logging platform analysing them must be flexible in handling such events and Bronto can do this and you could even add a custom parser for the logs to make them more convenient to view and search.
Some example screens from the simple Ollama test setup, handling some requests from the demo API program are shown below and note that even though there are a relatively small number of logs produced during these tests, using small prompts, that there is a relatively large amount of data (2MB for 244 log events shown in Fig. 1):
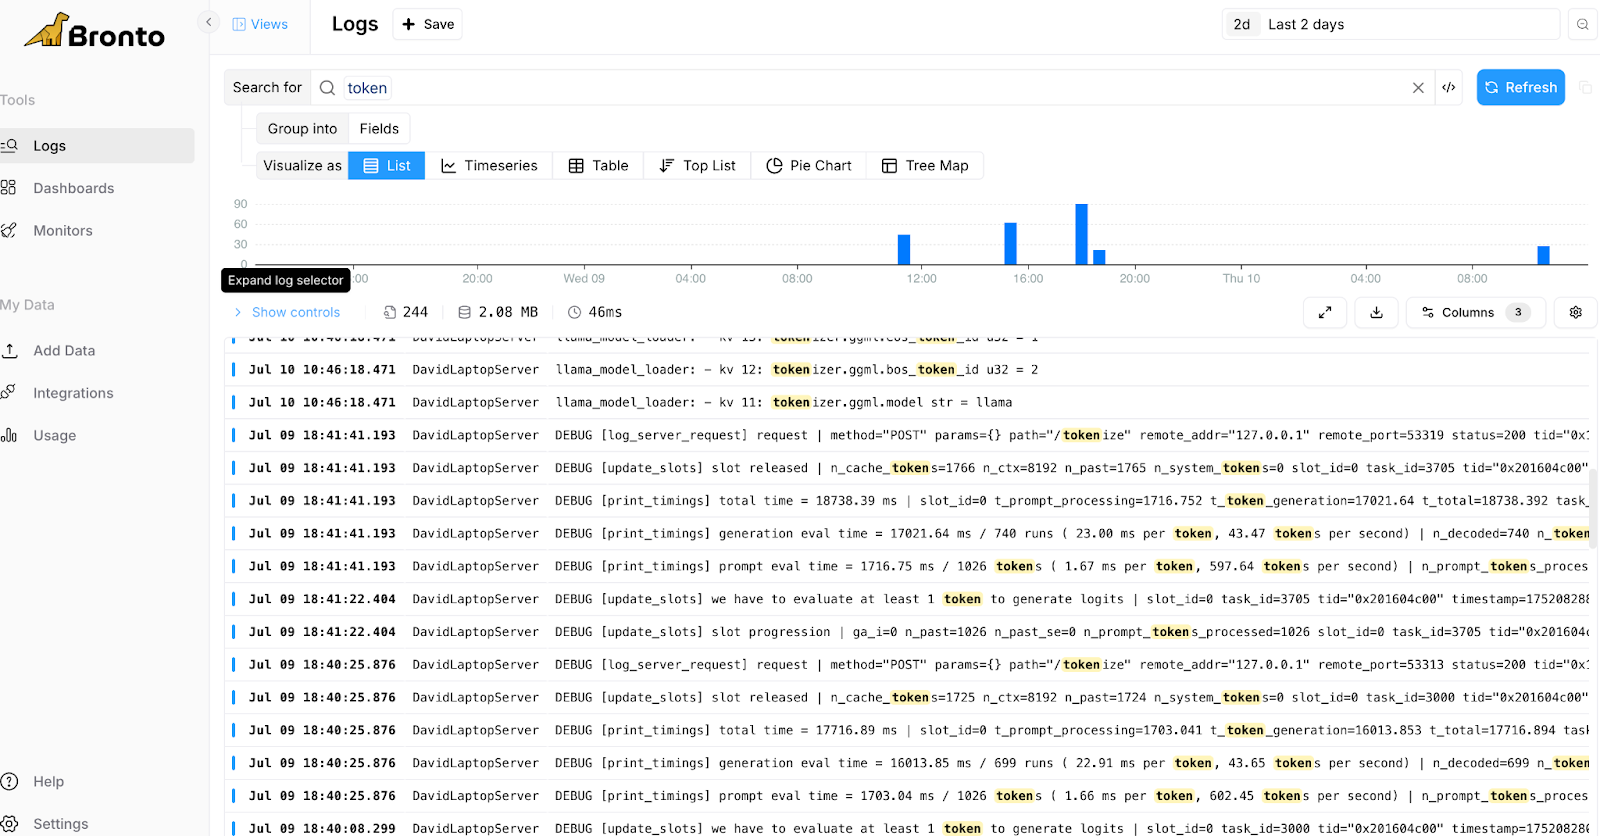
Fig.1 Searching for Log Events containing “tokens”
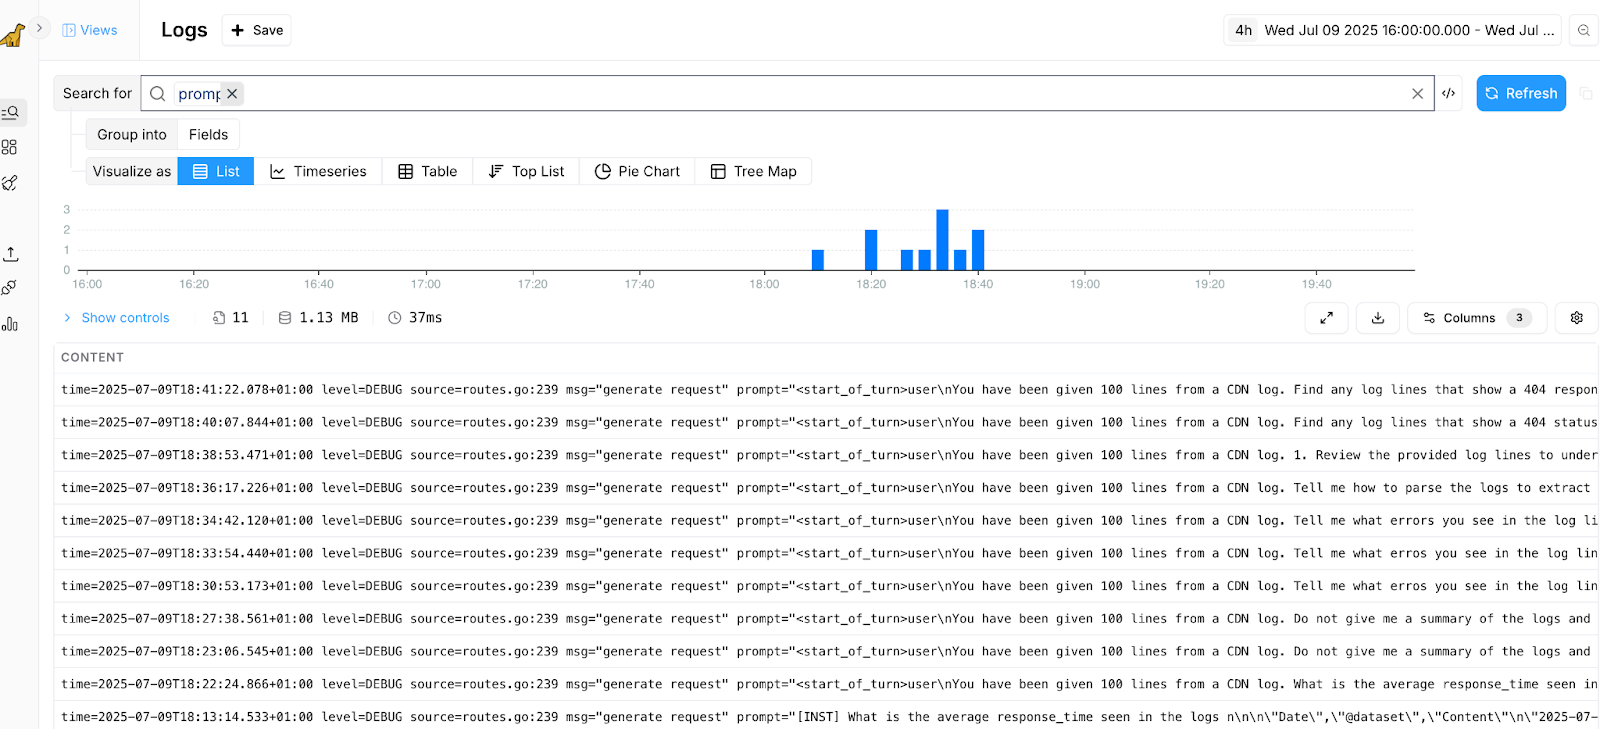
Fig.2 Searching for Log Events containing “prompt”
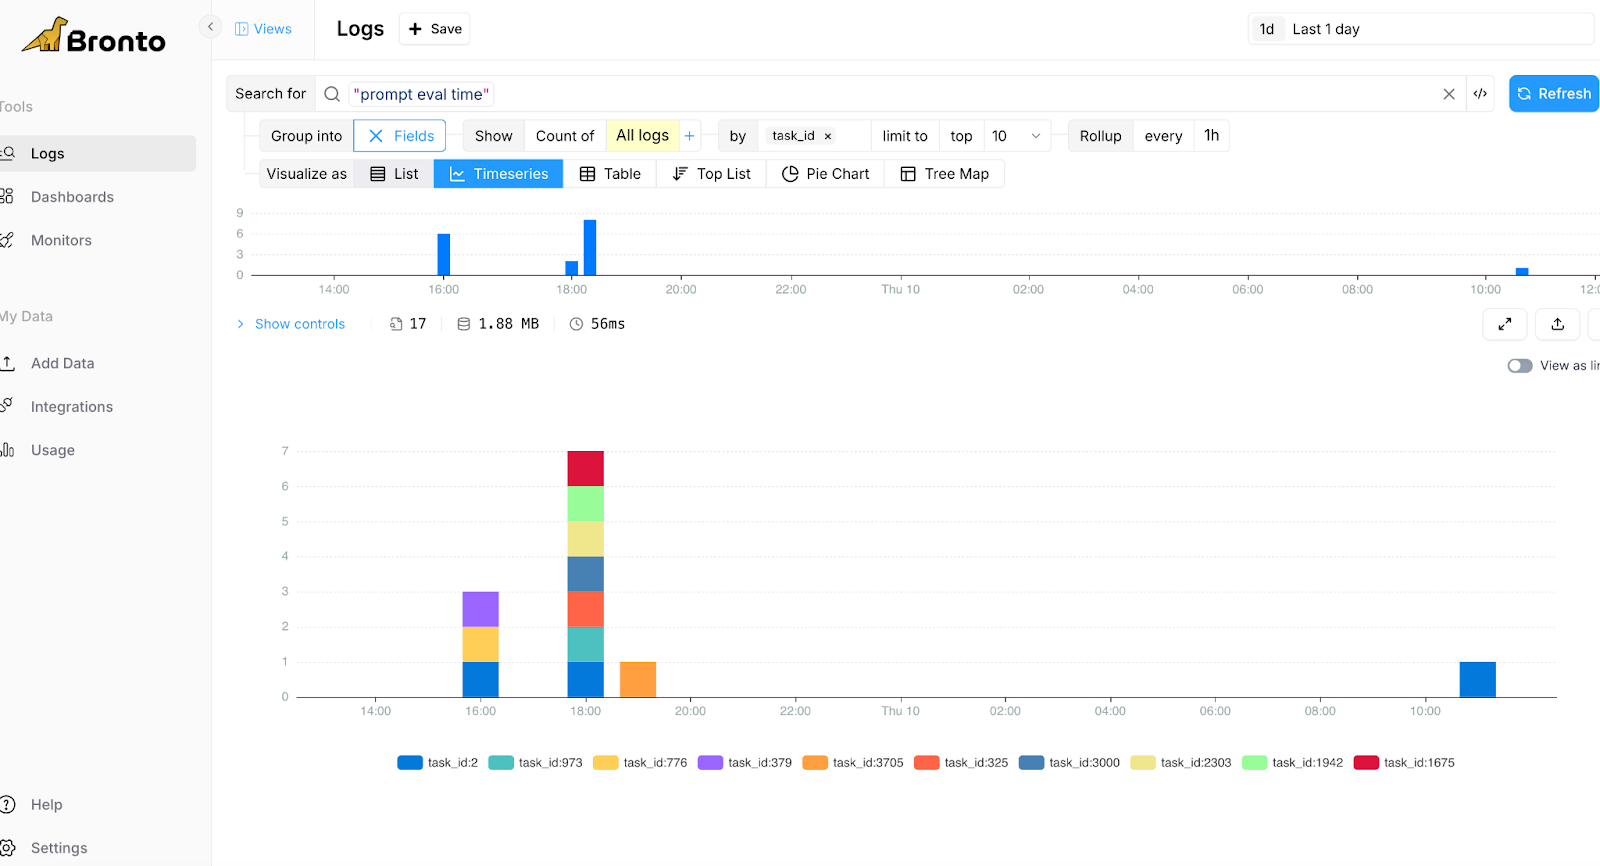
Fig. 3 Grouping by Prompt evaluation time per task_id
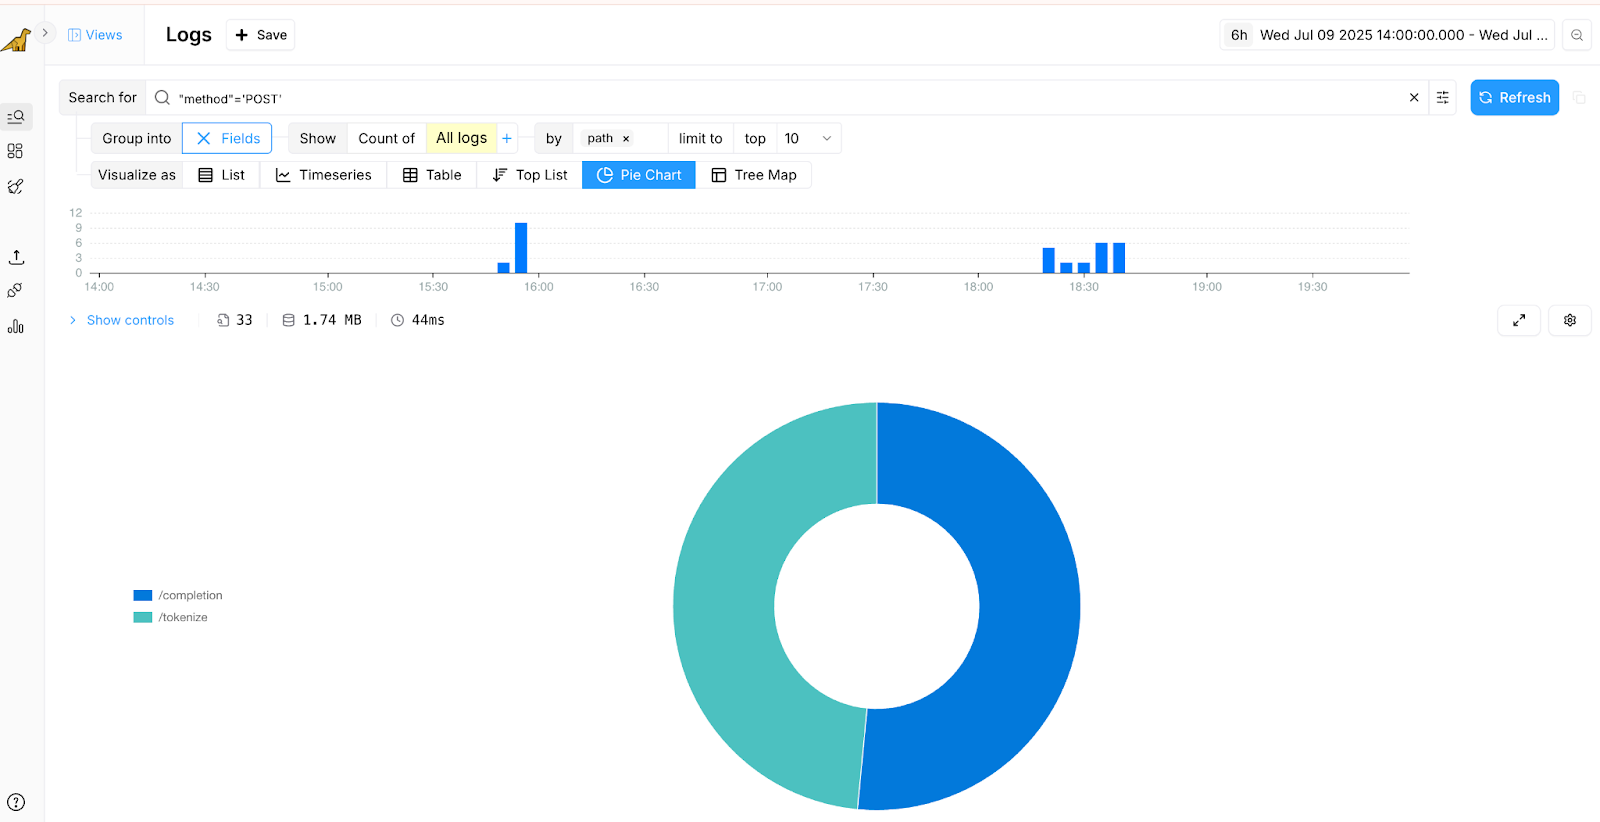
Fig.4 Showing HTTP POST calls per Ollama Server API Endpoints
Conclusion
This blog has introduced Ollama as an example of an LLM system and why LLM logs need Bronto as the logging layer for the AI era as it has been specificially designed for fast search and large volumes of logs. The blog has also shown how to set Ollama up locally and how to configure OpenTelemetry to send Ollama logs to the Bronto logging platform. It has also shown how easy it is to write an API program to experiment with models and prompts in Ollama and also shown examples of how Bronto can be used to analyse those Ollama logs.
Future blogs will develop the theme of logging for AI systems further and show more examples of using AI logs from systems like AWS Bedrock.
Appendix

Try Bronto free for 14 days
Centralize your agent and infrastructure telemetry in one platform with sub-second search and 12-month hot retention. No credit card required.