The Intelligent
Observability
Data Platform
 The Intelligent


A new way to do observability
Three purpose-built layers, stacked to deliver outcomes nothing else can match.


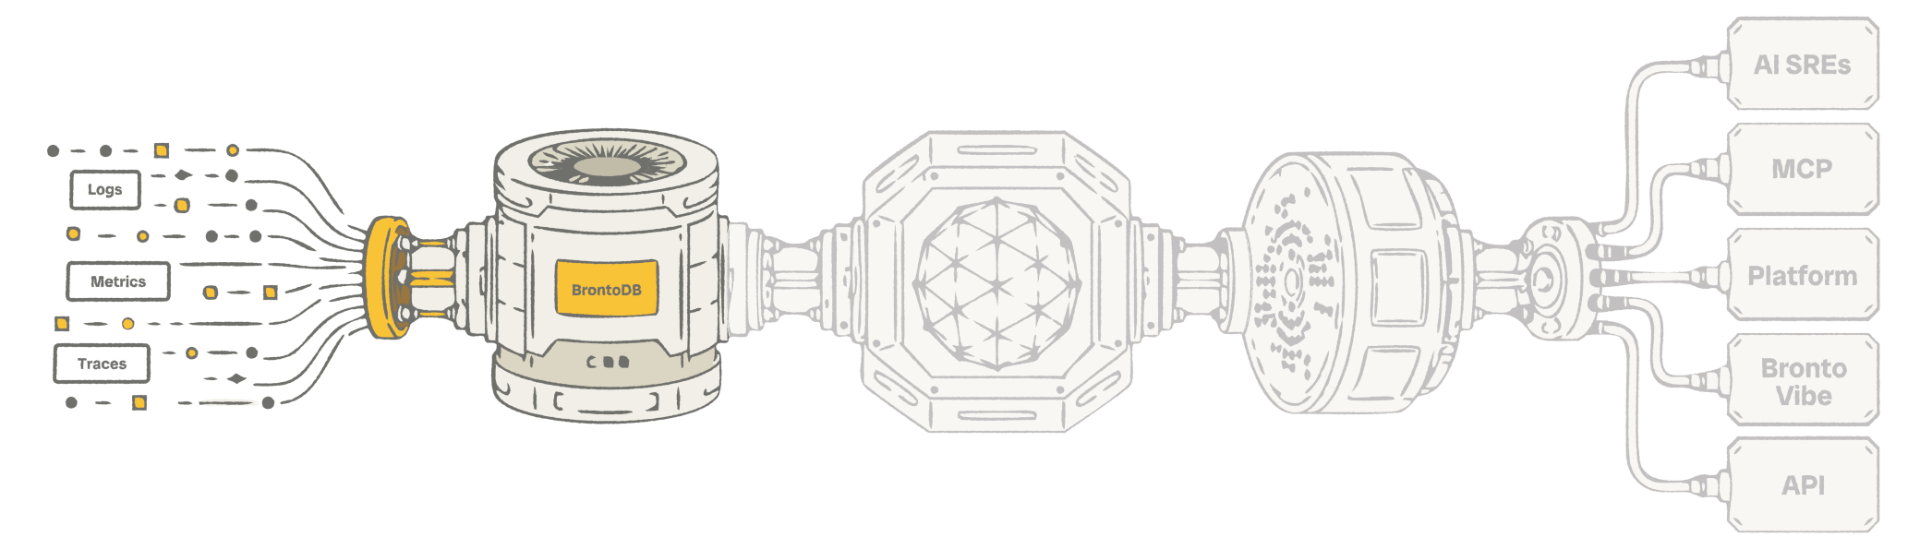
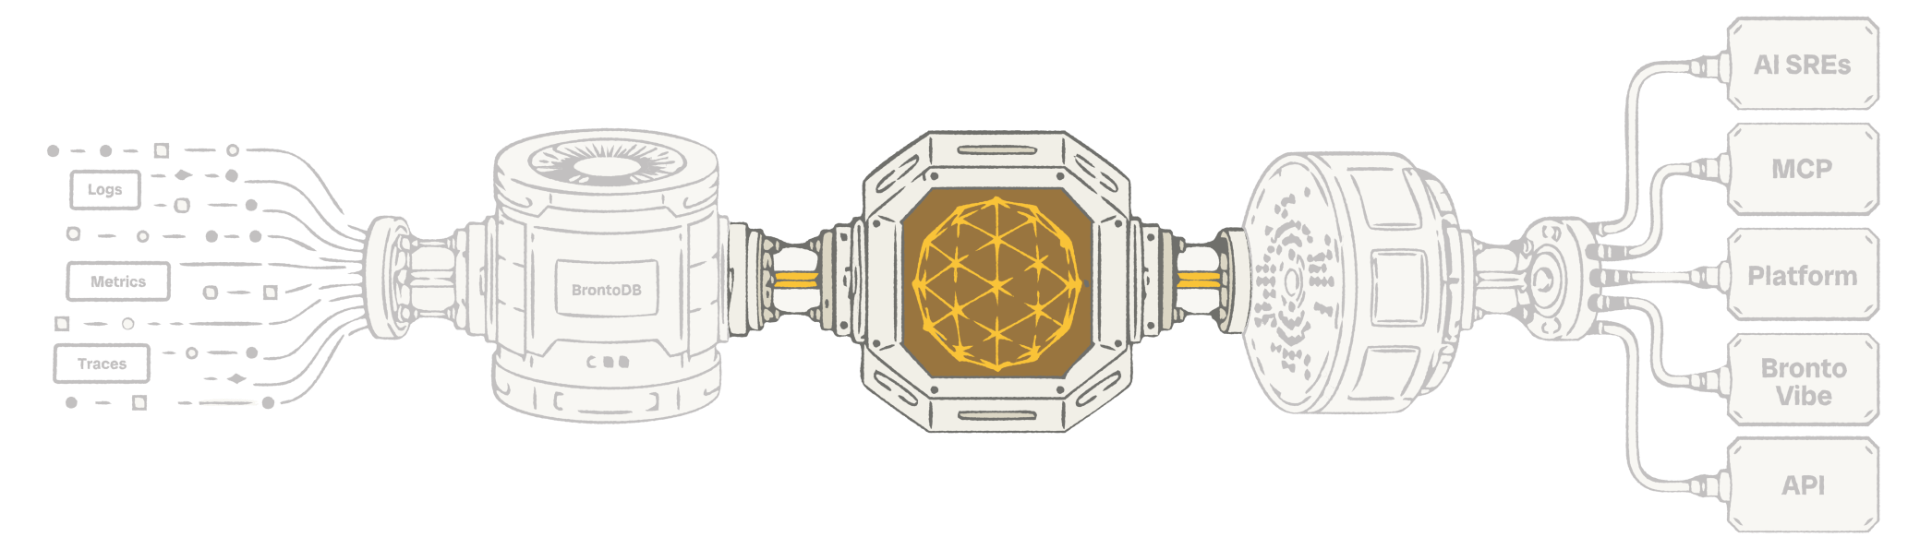
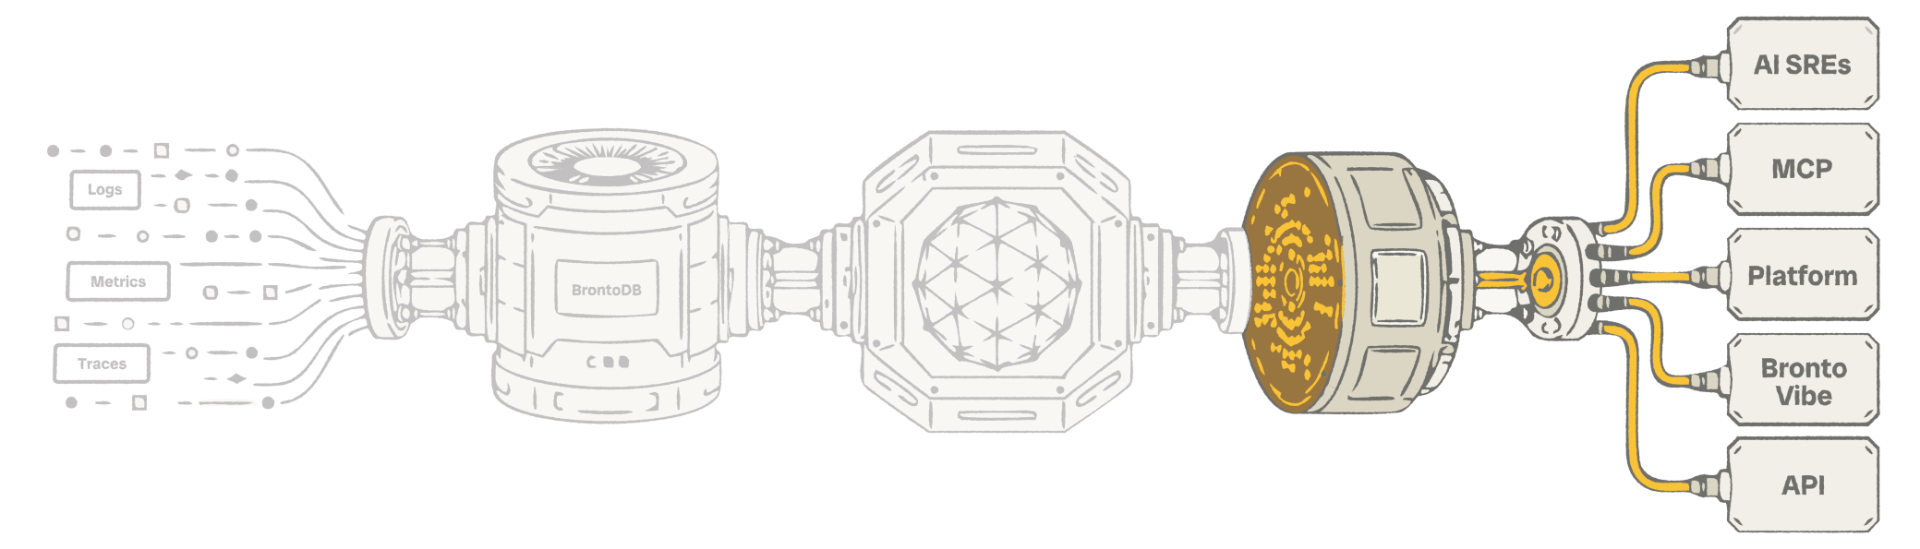
Step 1:Send 100% of your data, full fidelity, no blindspots, always hot.
Up to 90% lower storage cost
Purpose-built columnar storage replaces expensive hot tiers.
10x faster search
Sub-second queries across petabytes — no rehydration.
1 year retention by default
Keep a full year of hot, queryable data, included.
No blind spots
Full coverage of logs, metrics, and traces — nothing dropped.
Petabyte scale
Scales horizontally without re-architecting your stack.
Full fidelity, no sampling
Every byte stored exactly as received.

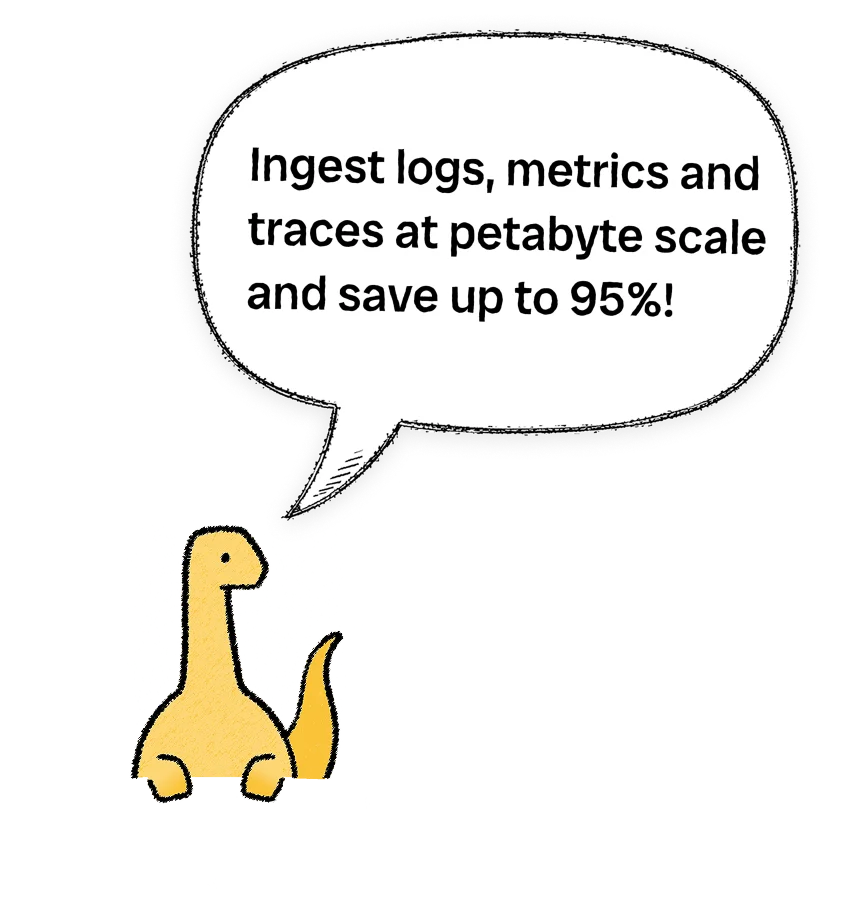
Bronto loves scale.
And fast answers.
Store 10x more data at up to 95% lower cost — and get faster MTTR, less downtime, and instant answers across every byte.
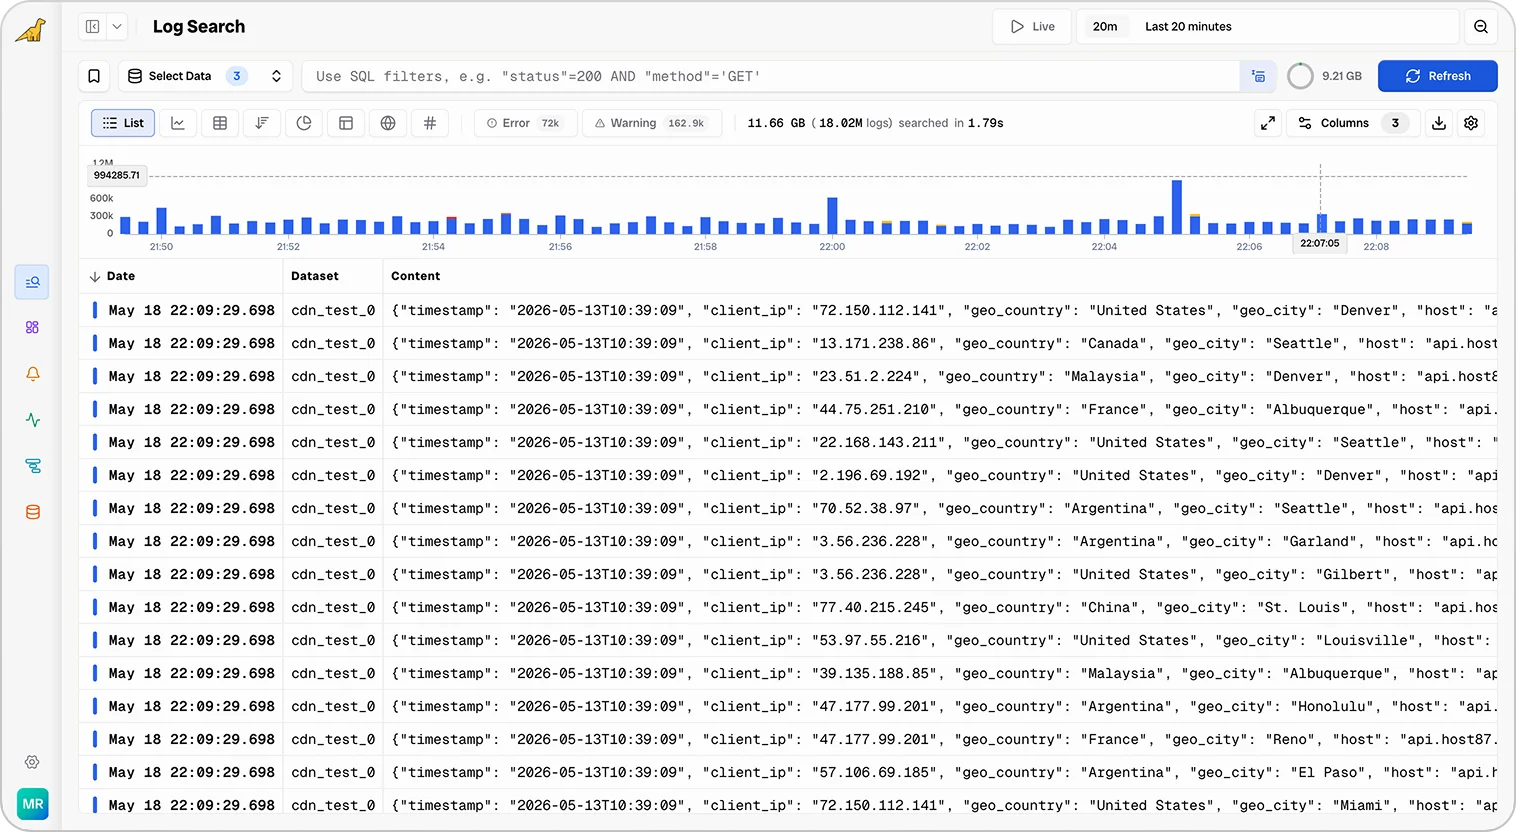
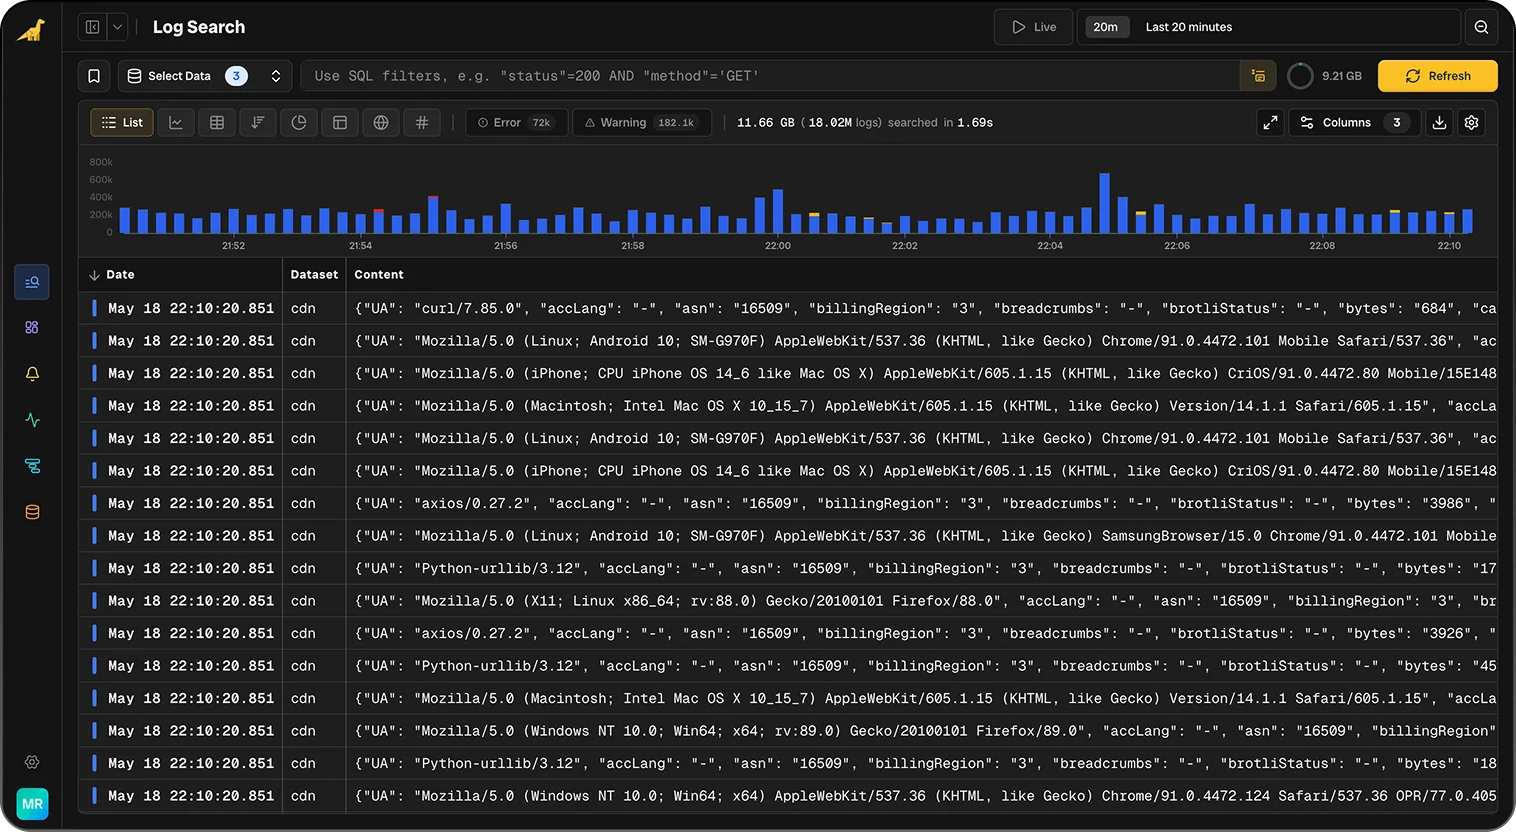
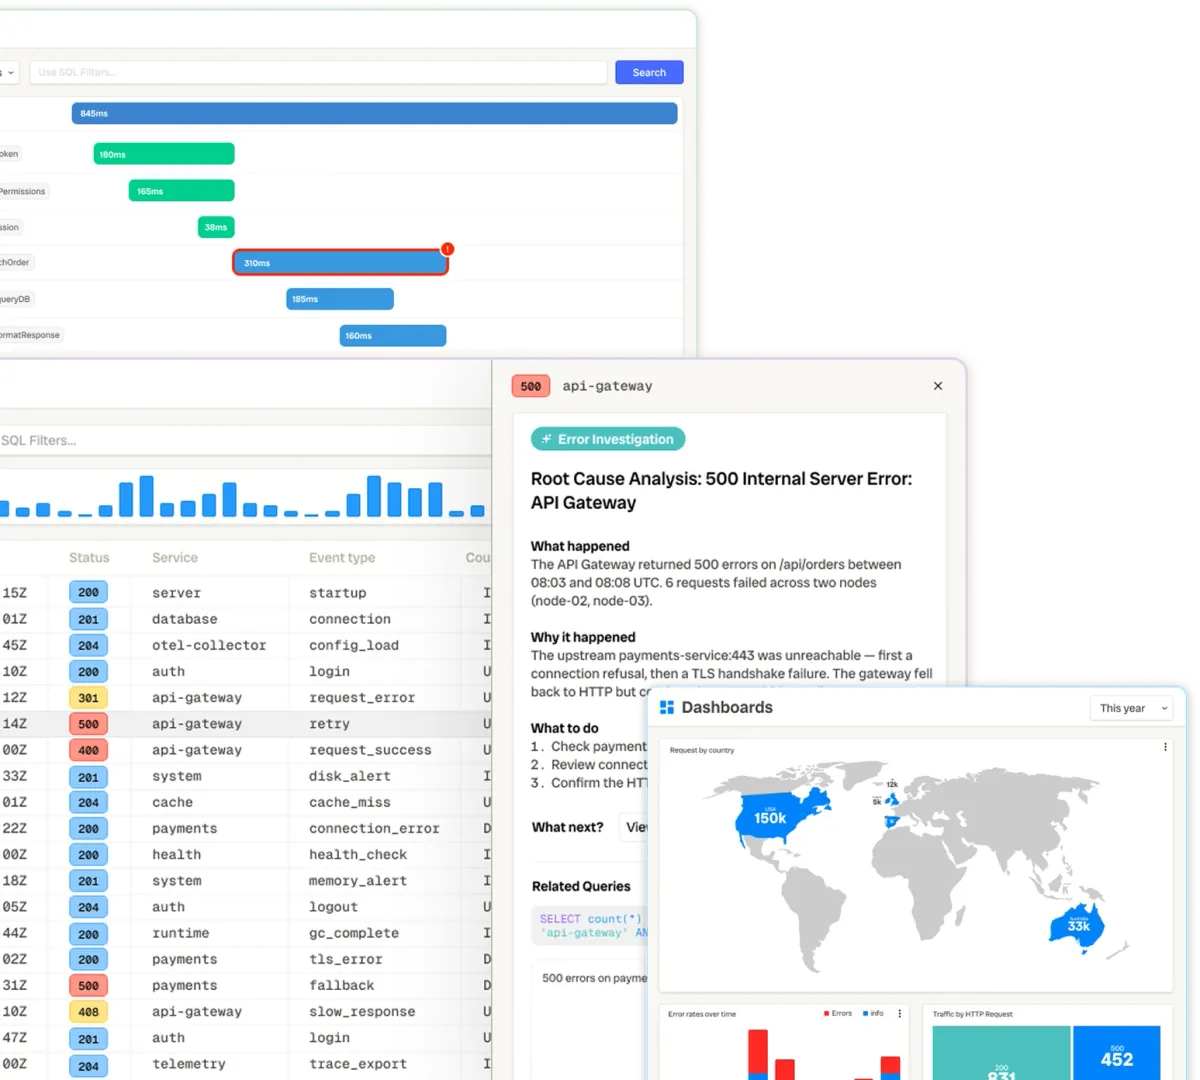
Search Your Logs Instantly
Filter terabytes of logs in sub-seconds with smart SQL autocomplete and keyboard-driven shortcuts.
Trace Every Request End-to-End
Follow requests across every service, queue, and database. Pinpoint latency and errors with distributed tracing and waterfall view.
High-Cardinality Metrics, No Limits
Collect, store, and query infrastructure and application metrics with full granularity. 12-month retention out of the box, with sub-second queries even at high cardinality.
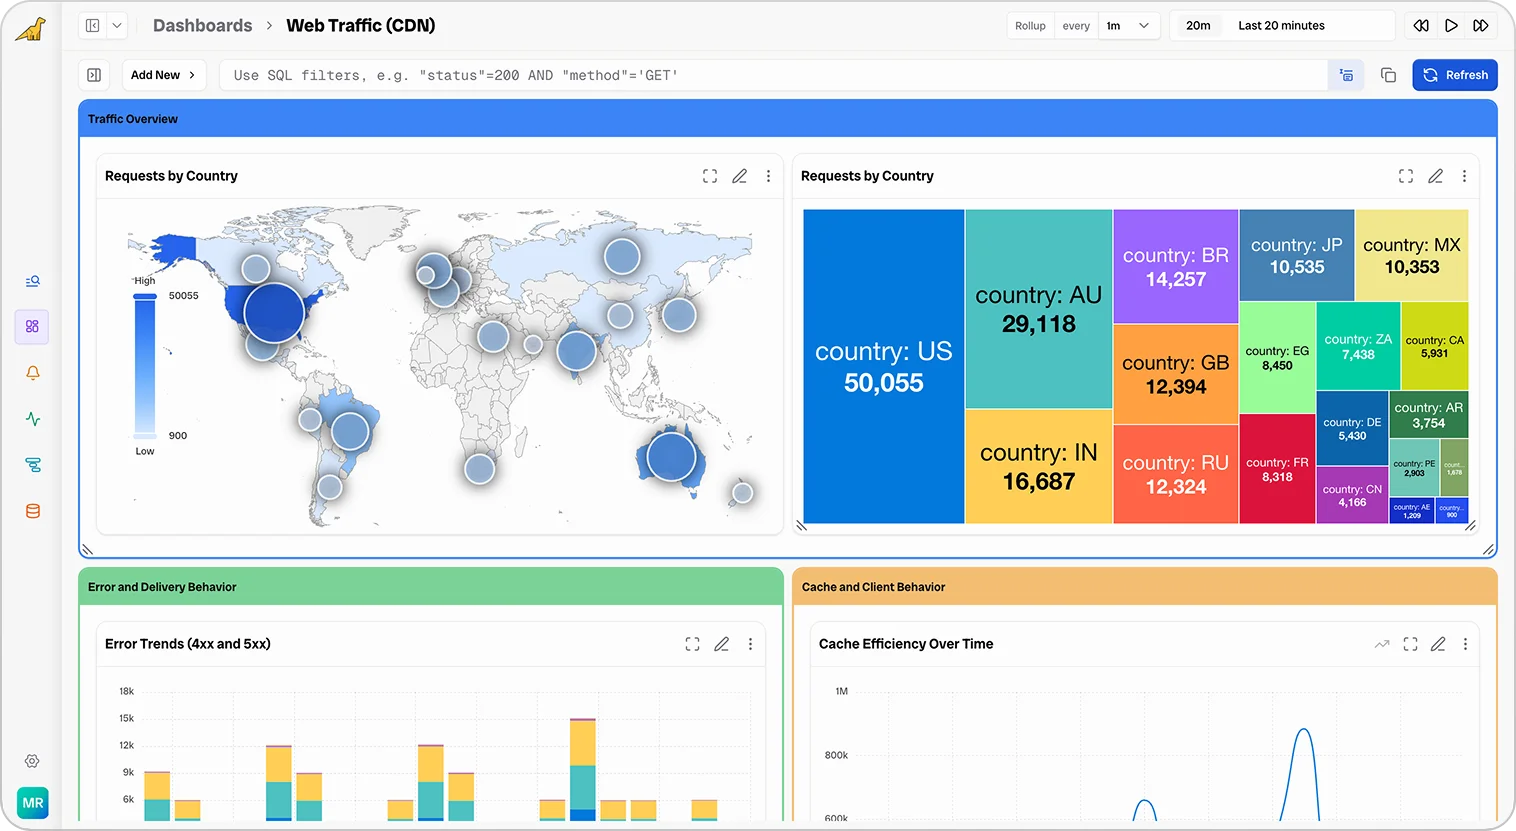
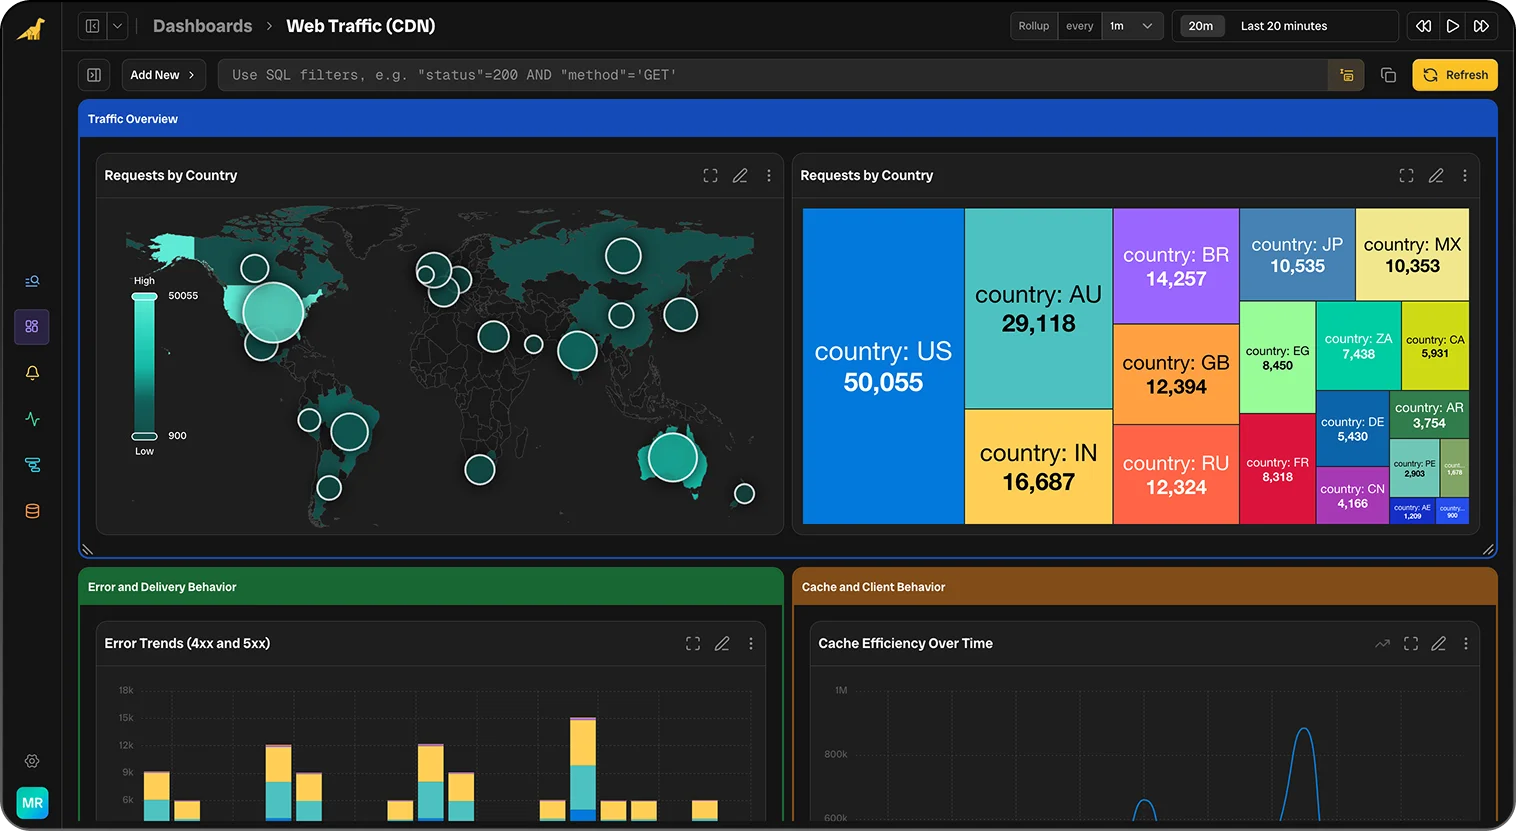
Insanely Quick Dashboards
Drag-and-drop dashboards rendered in seconds, even over petabytes. Start from suggested templates or build your own.
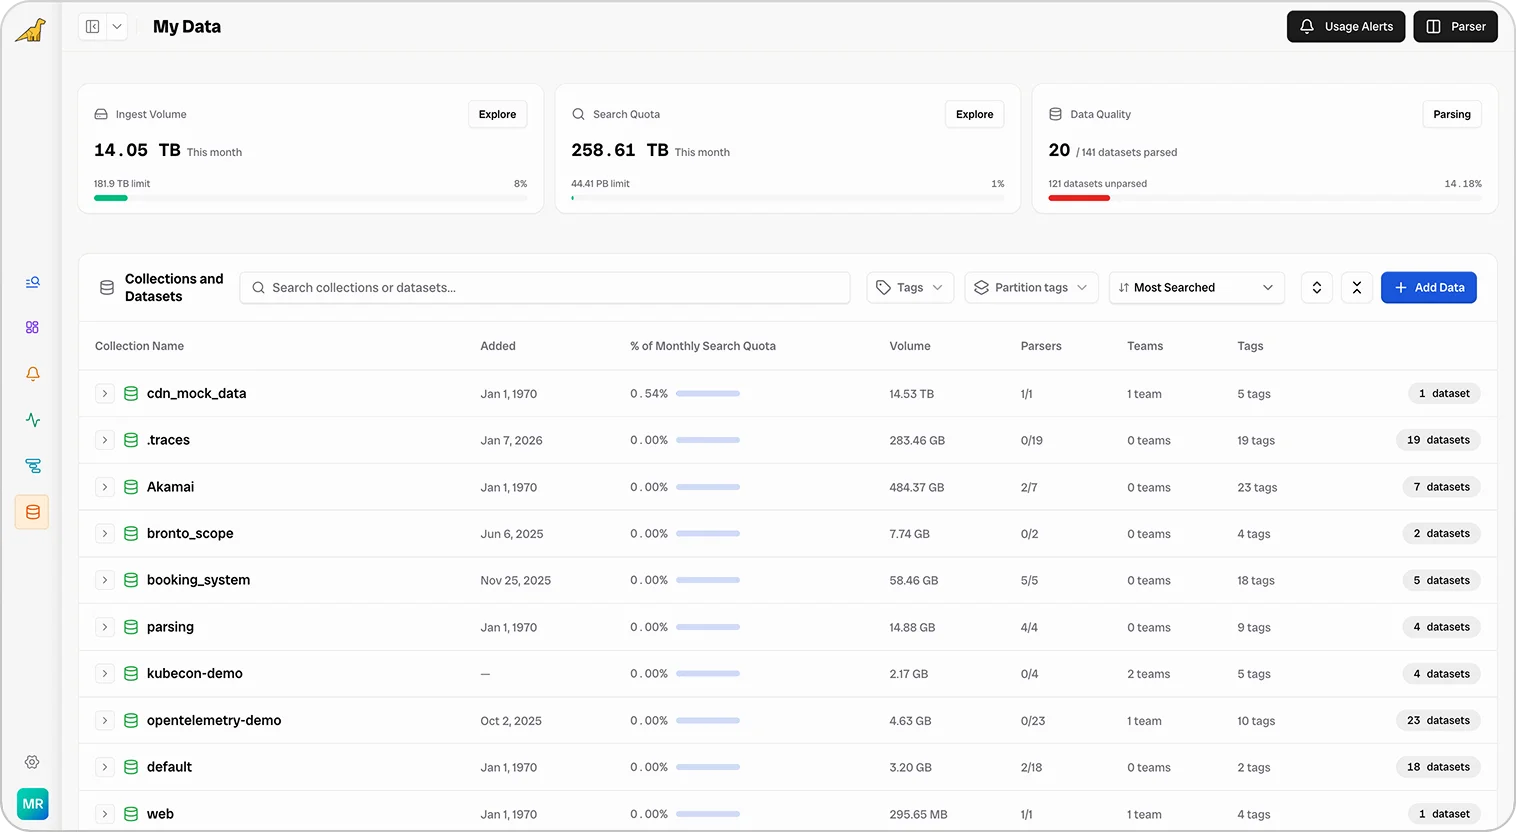
Full Transparency Into Usage & Cost
See exactly how your data is being used and by whom. Break down ingest, storage, and queries per team, service, or user, so you stay in control of cost and value.
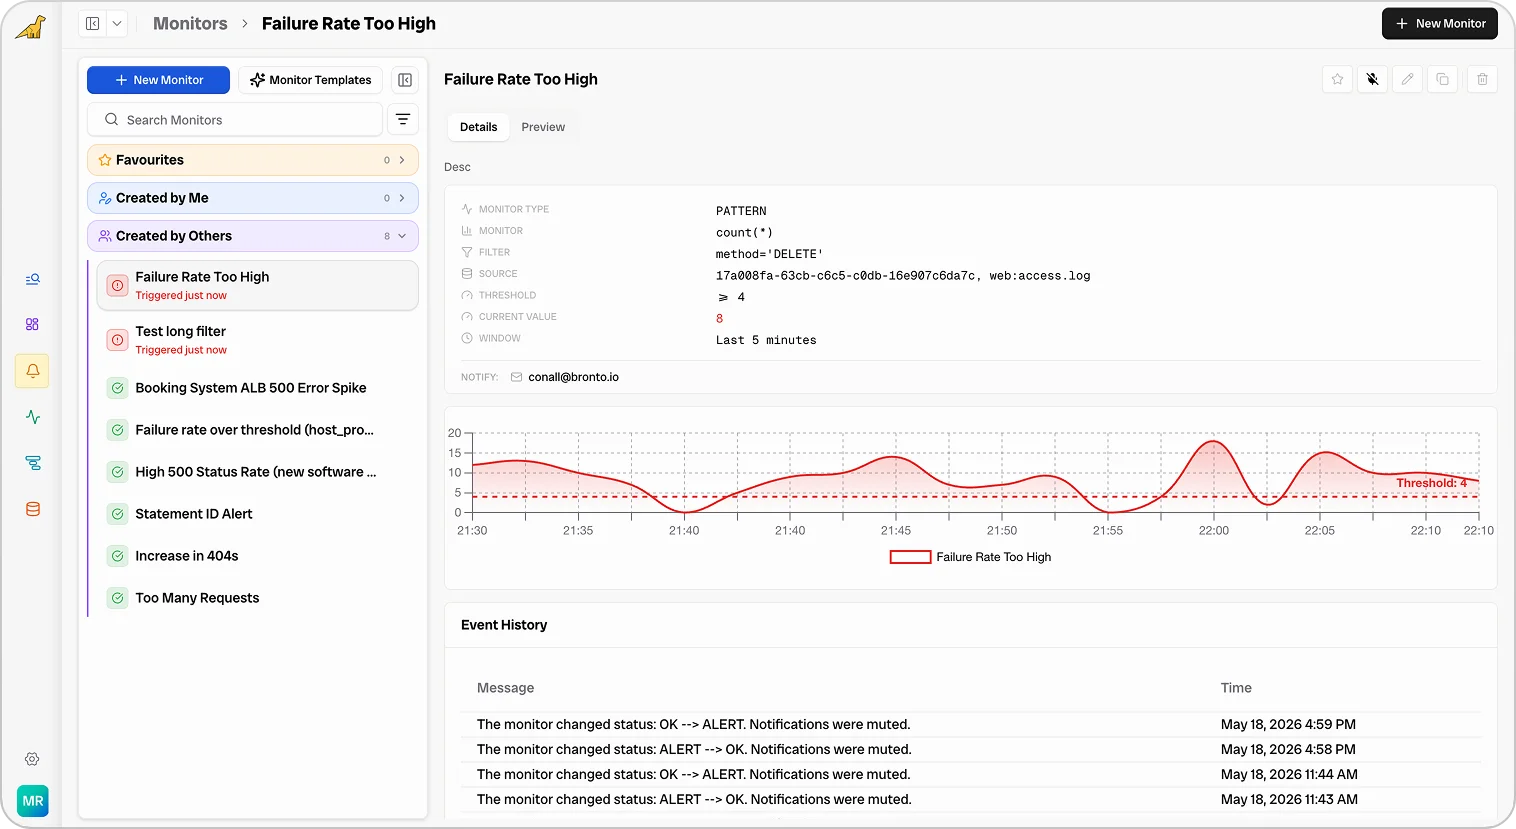
Intelligent Alerting & Reporting
AI-tuned alerts cut noise and surface what matters, with shareable reports that turn every incident and trend into clear, actionable insight.
Optimised for your new workflow
Whether you live in your IDE, your terminal, or your own UI — Bronto plugs into the way you already work.
Bronto MCP
Plug Bronto straight into Claude, Cursor, and any MCP-aware agent so your logs, metrics, and traces become a first-class tool call.
REST & Query API
Programmatic access to every query, dashboard, and alert.
CLI & Terminal
Search, tail, and pipe Bronto data right from your shell.
Build Your Own UI
Use our APIs and MCP server with tools like Lovable and V0 to build internal tools, custom dashboards, and bespoke workflows on top of Bronto's data.


AI SREs
Let autonomous agents triage incidents, investigate anomalies, and surface root cause in seconds.


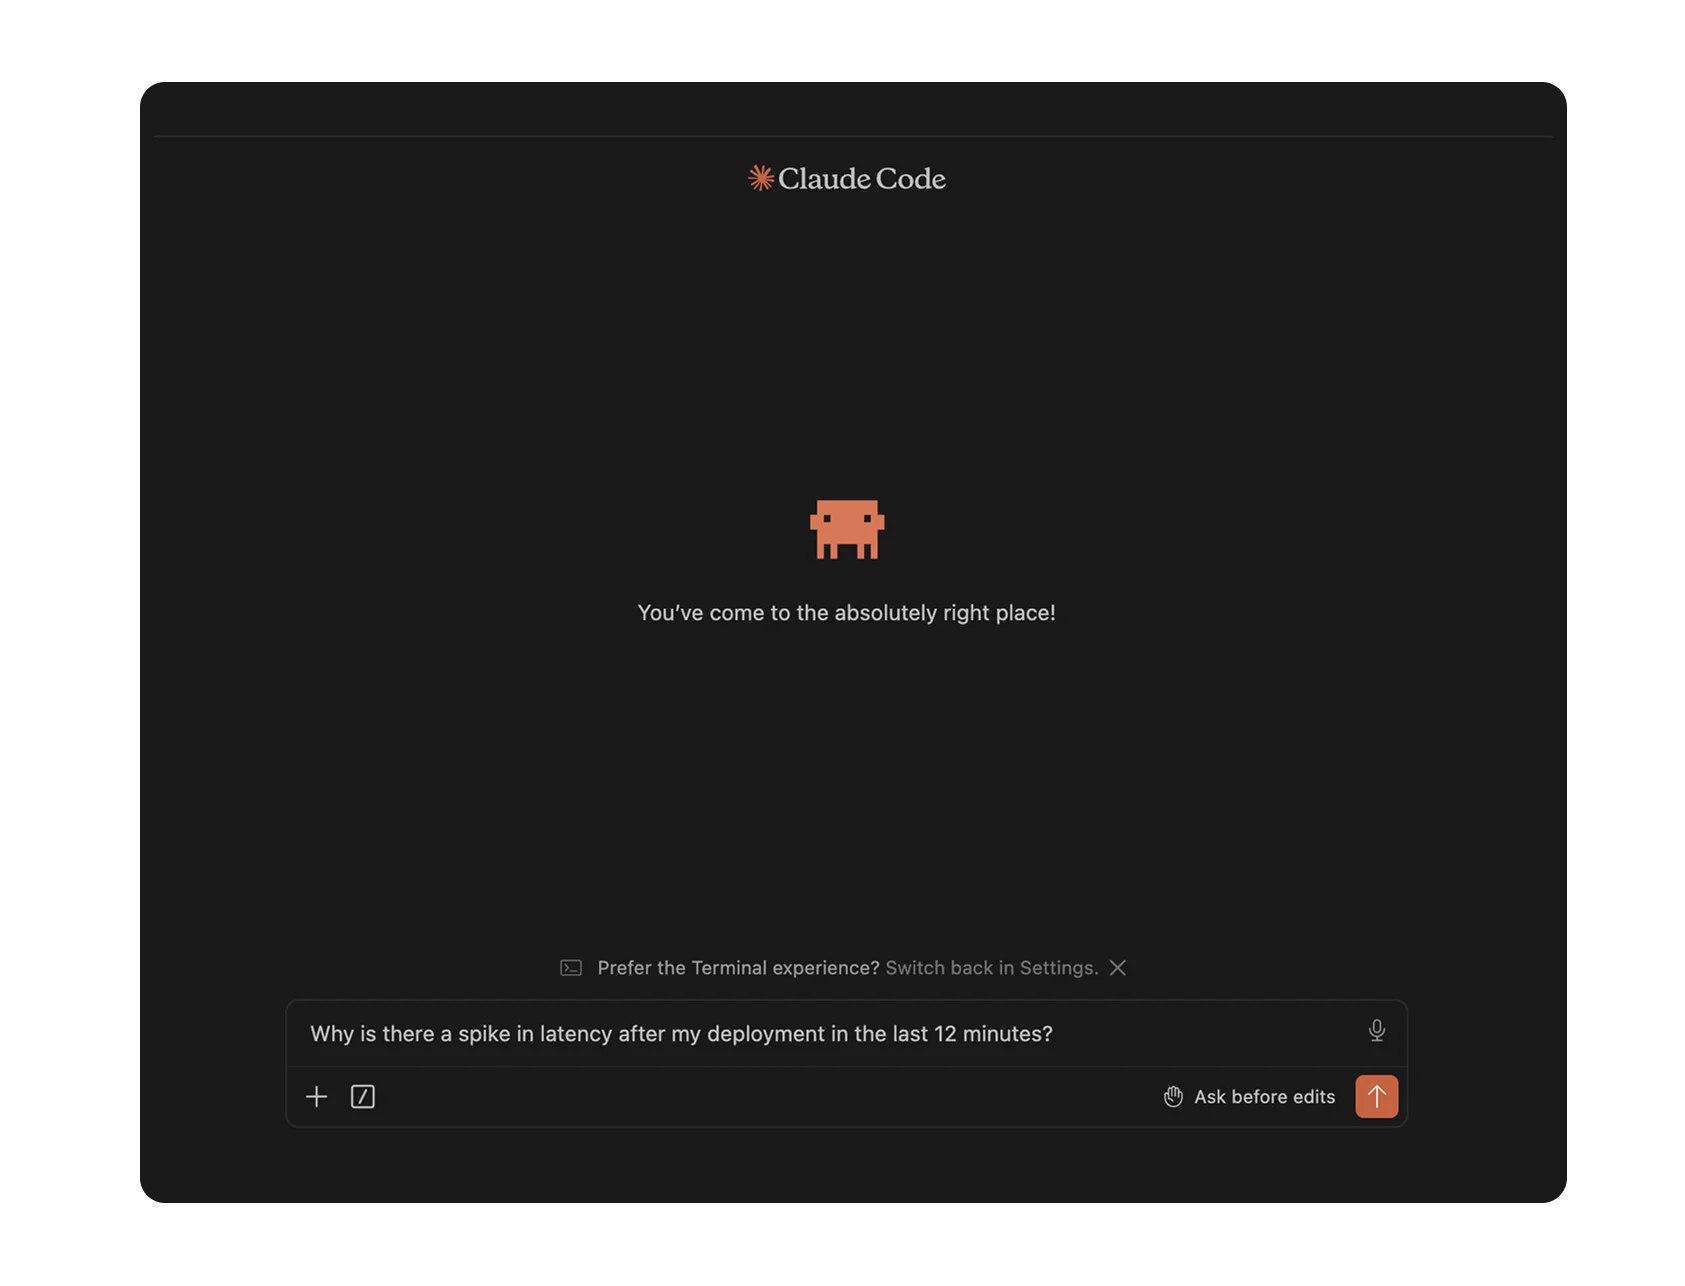
Your IDE & Coding Agents
Query your telemetry without leaving your IDE or coding agent of choice.

Get started in minutes.
Send data from anywhere with OTEL-native ingestion, get every field automatically structured, parsed, and searchable, and start exploring with pre-built dashboards, alerts, and searches from day one.


%20--%3e%3csvg%20version='1.1'%20id='Layer_1'%20xmlns='http://www.w3.org/2000/svg'%20xmlns:xlink='http://www.w3.org/1999/xlink'%20x='0px'%20y='0px'%20viewBox='0%200%20304%20182'%20style='enable-background:new%200%200%20304%20182;'%20xml:space='preserve'%3e%3cstyle%20type='text/css'%3e%20.st0{fill:%23252F3E;}%20.st1{fill-rule:evenodd;clip-rule:evenodd;fill:%23FF9900;}%20%3c/style%3e%3cg%3e%3cpath%20class='st0'%20d='M86.4,66.4c0,3.7,0.4,6.7,1.1,8.9c0.8,2.2,1.8,4.6,3.2,7.2c0.5,0.8,0.7,1.6,0.7,2.3c0,1-0.6,2-1.9,3l-6.3,4.2%20c-0.9,0.6-1.8,0.9-2.6,0.9c-1,0-2-0.5-3-1.4C76.2,90,75,88.4,74,86.8c-1-1.7-2-3.6-3.1-5.9c-7.8,9.2-17.6,13.8-29.4,13.8%20c-8.4,0-15.1-2.4-20-7.2c-4.9-4.8-7.4-11.2-7.4-19.2c0-8.5,3-15.4,9.1-20.6c6.1-5.2,14.2-7.8,24.5-7.8c3.4,0,6.9,0.3,10.6,0.8%20c3.7,0.5,7.5,1.3,11.5,2.2v-7.3c0-7.6-1.6-12.9-4.7-16c-3.2-3.1-8.6-4.6-16.3-4.6c-3.5,0-7.1,0.4-10.8,1.3c-3.7,0.9-7.3,2-10.8,3.4%20c-1.6,0.7-2.8,1.1-3.5,1.3c-0.7,0.2-1.2,0.3-1.6,0.3c-1.4,0-2.1-1-2.1-3.1v-4.9c0-1.6,0.2-2.8,0.7-3.5c0.5-0.7,1.4-1.4,2.8-2.1%20c3.5-1.8,7.7-3.3,12.6-4.5c4.9-1.3,10.1-1.9,15.6-1.9c11.9,0,20.6,2.7,26.2,8.1c5.5,5.4,8.3,13.6,8.3,24.6V66.4z%20M45.8,81.6%20c3.3,0,6.7-0.6,10.3-1.8c3.6-1.2,6.8-3.4,9.5-6.4c1.6-1.9,2.8-4,3.4-6.4c0.6-2.4,1-5.3,1-8.7v-4.2c-2.9-0.7-6-1.3-9.2-1.7%20c-3.2-0.4-6.3-0.6-9.4-0.6c-6.7,0-11.6,1.3-14.9,4c-3.3,2.7-4.9,6.5-4.9,11.5c0,4.7,1.2,8.2,3.7,10.6%20C37.7,80.4,41.2,81.6,45.8,81.6z%20M126.1,92.4c-1.8,0-3-0.3-3.8-1c-0.8-0.6-1.5-2-2.1-3.9L96.7,10.2c-0.6-2-0.9-3.3-0.9-4%20c0-1.6,0.8-2.5,2.4-2.5h9.8c1.9,0,3.2,0.3,3.9,1c0.8,0.6,1.4,2,2,3.9l16.8,66.2l15.6-66.2c0.5-2,1.1-3.3,1.9-3.9c0.8-0.6,2.2-1,4-1%20h8c1.9,0,3.2,0.3,4,1c0.8,0.6,1.5,2,1.9,3.9l15.8,67l17.3-67c0.6-2,1.3-3.3,2-3.9c0.8-0.6,2.1-1,3.9-1h9.3c1.6,0,2.5,0.8,2.5,2.5%20c0,0.5-0.1,1-0.2,1.6c-0.1,0.6-0.3,1.4-0.7,2.5l-24.1,77.3c-0.6,2-1.3,3.3-2.1,3.9c-0.8,0.6-2.1,1-3.8,1h-8.6c-1.9,0-3.2-0.3-4-1%20c-0.8-0.7-1.5-2-1.9-4L156,23l-15.4,64.4c-0.5,2-1.1,3.3-1.9,4c-0.8,0.7-2.2,1-4,1H126.1z%20M254.6,95.1c-5.2,0-10.4-0.6-15.4-1.8%20c-5-1.2-8.9-2.5-11.5-4c-1.6-0.9-2.7-1.9-3.1-2.8c-0.4-0.9-0.6-1.9-0.6-2.8v-5.1c0-2.1,0.8-3.1,2.3-3.1c0.6,0,1.2,0.1,1.8,0.3%20c0.6,0.2,1.5,0.6,2.5,1c3.4,1.5,7.1,2.7,11,3.5c4,0.8,7.9,1.2,11.9,1.2c6.3,0,11.2-1.1,14.6-3.3c3.4-2.2,5.2-5.4,5.2-9.5%20c0-2.8-0.9-5.1-2.7-7c-1.8-1.9-5.2-3.6-10.1-5.2L246,52c-7.3-2.3-12.7-5.7-16-10.2c-3.3-4.4-5-9.3-5-14.5c0-4.2,0.9-7.9,2.7-11.1%20c1.8-3.2,4.2-6,7.2-8.2c3-2.3,6.4-4,10.4-5.2c4-1.2,8.2-1.7,12.6-1.7c2.2,0,4.5,0.1,6.7,0.4c2.3,0.3,4.4,0.7,6.5,1.1%20c2,0.5,3.9,1,5.7,1.6c1.8,0.6,3.2,1.2,4.2,1.8c1.4,0.8,2.4,1.6,3,2.5c0.6,0.8,0.9,1.9,0.9,3.3v4.7c0,2.1-0.8,3.2-2.3,3.2%20c-0.8,0-2.1-0.4-3.8-1.2c-5.7-2.6-12.1-3.9-19.2-3.9c-5.7,0-10.2,0.9-13.3,2.8c-3.1,1.9-4.7,4.8-4.7,8.9c0,2.8,1,5.2,3,7.1%20c2,1.9,5.7,3.8,11,5.5l14.2,4.5c7.2,2.3,12.4,5.5,15.5,9.6c3.1,4.1,4.6,8.8,4.6,14c0,4.3-0.9,8.2-2.6,11.6%20c-1.8,3.4-4.2,6.4-7.3,8.8c-3.1,2.5-6.8,4.3-11.1,5.6C264.4,94.4,259.7,95.1,254.6,95.1z'/%3e%3cg%3e%3cpath%20class='st1'%20d='M273.5,143.7c-32.9,24.3-80.7,37.2-121.8,37.2c-57.6,0-109.5-21.3-148.7-56.7c-3.1-2.8-0.3-6.6,3.4-4.4%20c42.4,24.6,94.7,39.5,148.8,39.5c36.5,0,76.6-7.6,113.5-23.2C274.2,133.6,278.9,139.7,273.5,143.7z'/%3e%3cpath%20class='st1'%20d='M287.2,128.1c-4.2-5.4-27.8-2.6-38.5-1.3c-3.2,0.4-3.7-2.4-0.8-4.5c18.8-13.2,49.7-9.4,53.3-5%20c3.6,4.5-1,35.4-18.6,50.2c-2.7,2.3-5.3,1.1-4.1-1.9C282.5,155.7,291.4,133.4,287.2,128.1z'/%3e%3c/g%3e%3c/g%3e%3c/svg%3e)

OTEL Native & Agent Agnostic
Ingest from OpenTelemetry, Fluentd, Fluent Bit, Vector, Datadog agents, and more. No lock-in.
All Your Data Structured & Parsed
Logs are parsed at ingestion using known formats or AI, so every field is structured and instantly searchable.
Pre-built Dashboards, Alerts & Searches
Start instantly with curated dashboards, alerts, and saved searches for common services and frameworks.
Chat to our team or get started with a free demo.

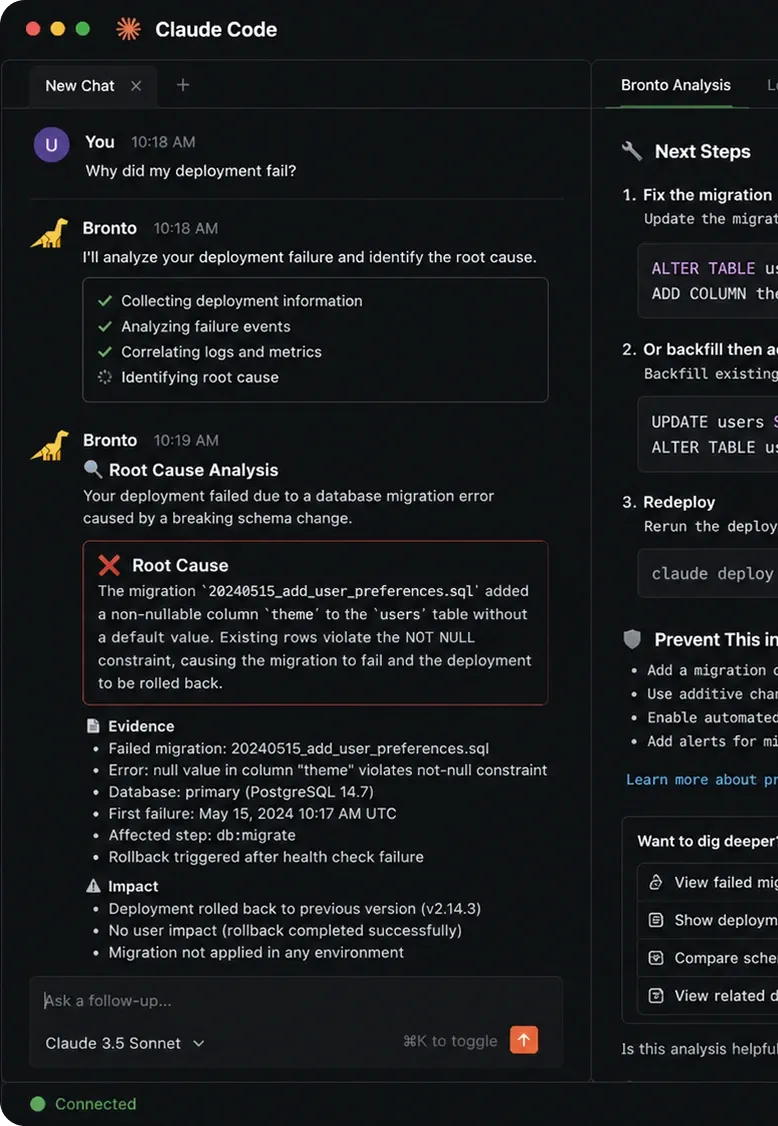
Bronto AI does the hard work,
so you can keep building.
AI is embedded throughout the entire platform — removing toil, surfacing root causes, and helping your team find answers in seconds, not hours.

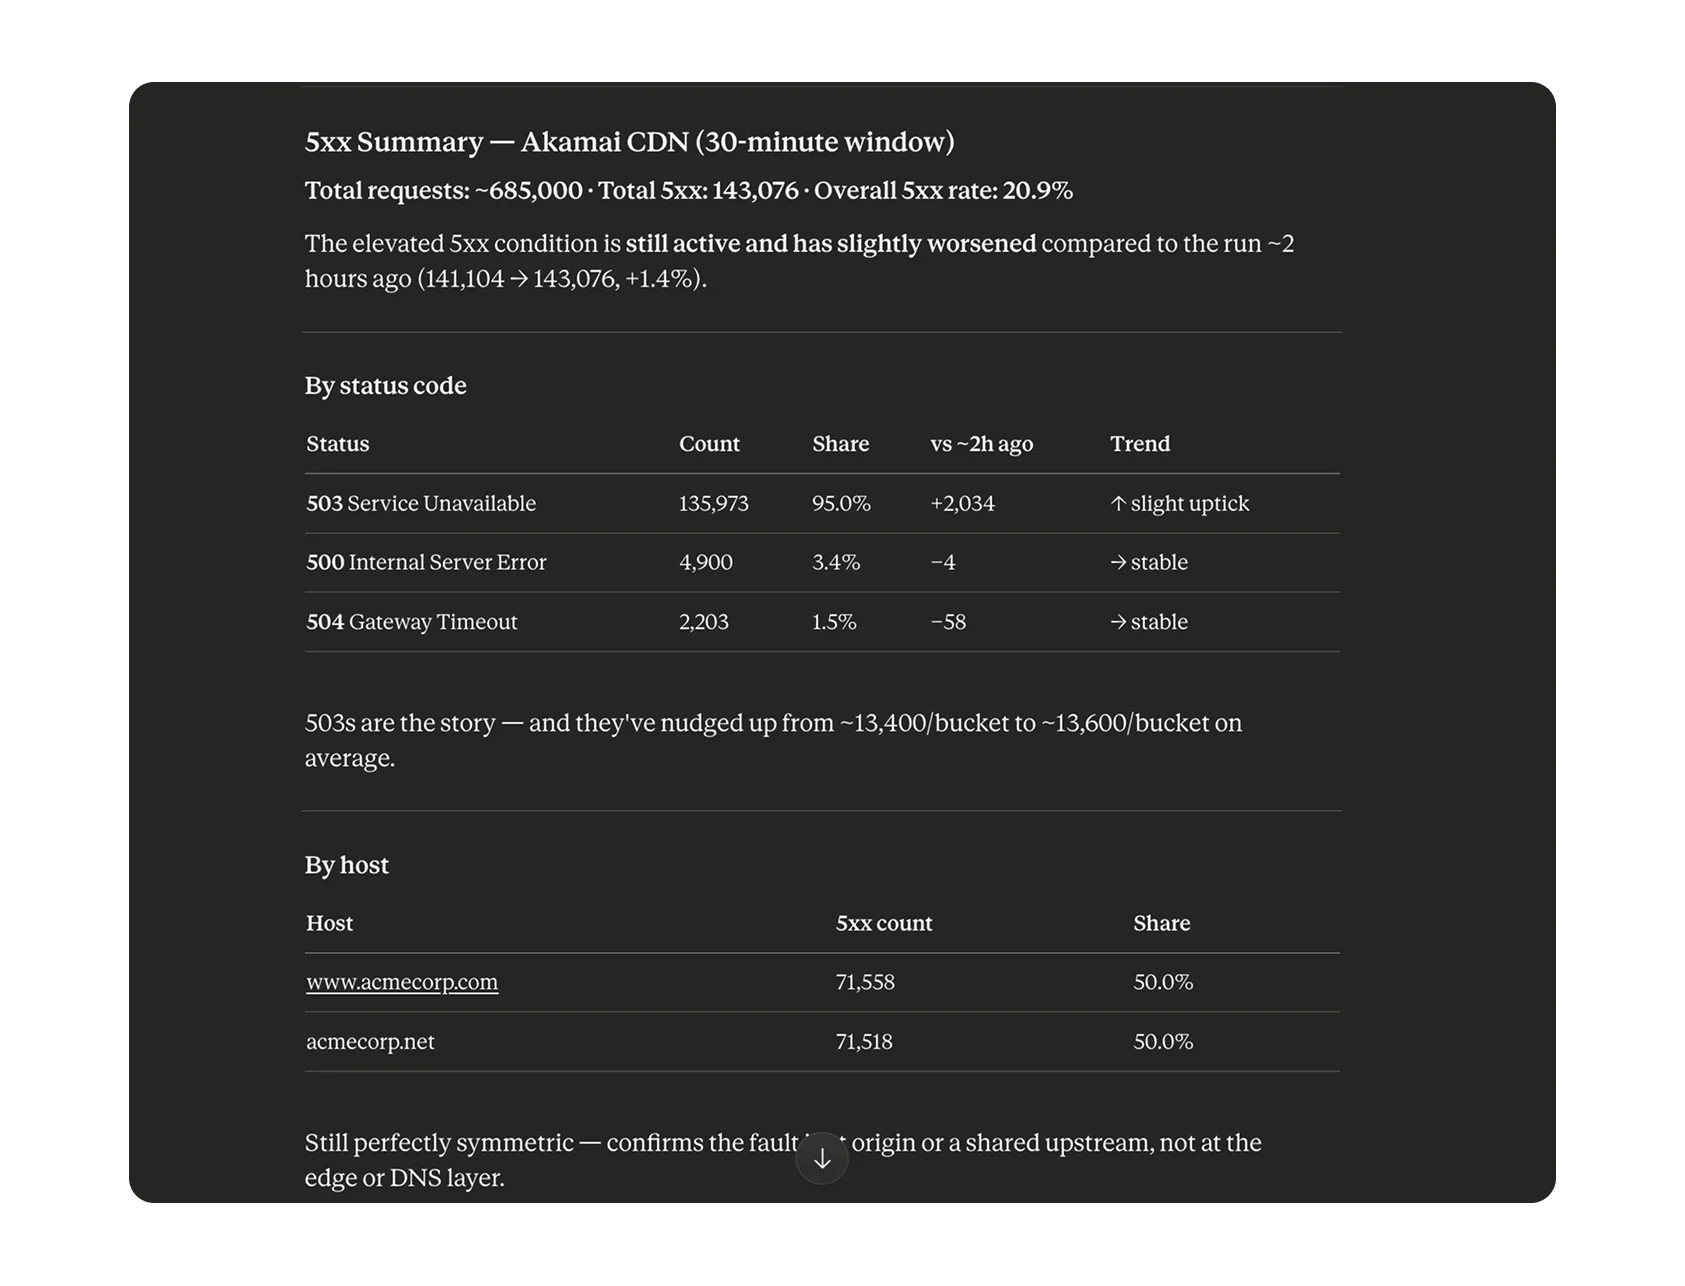
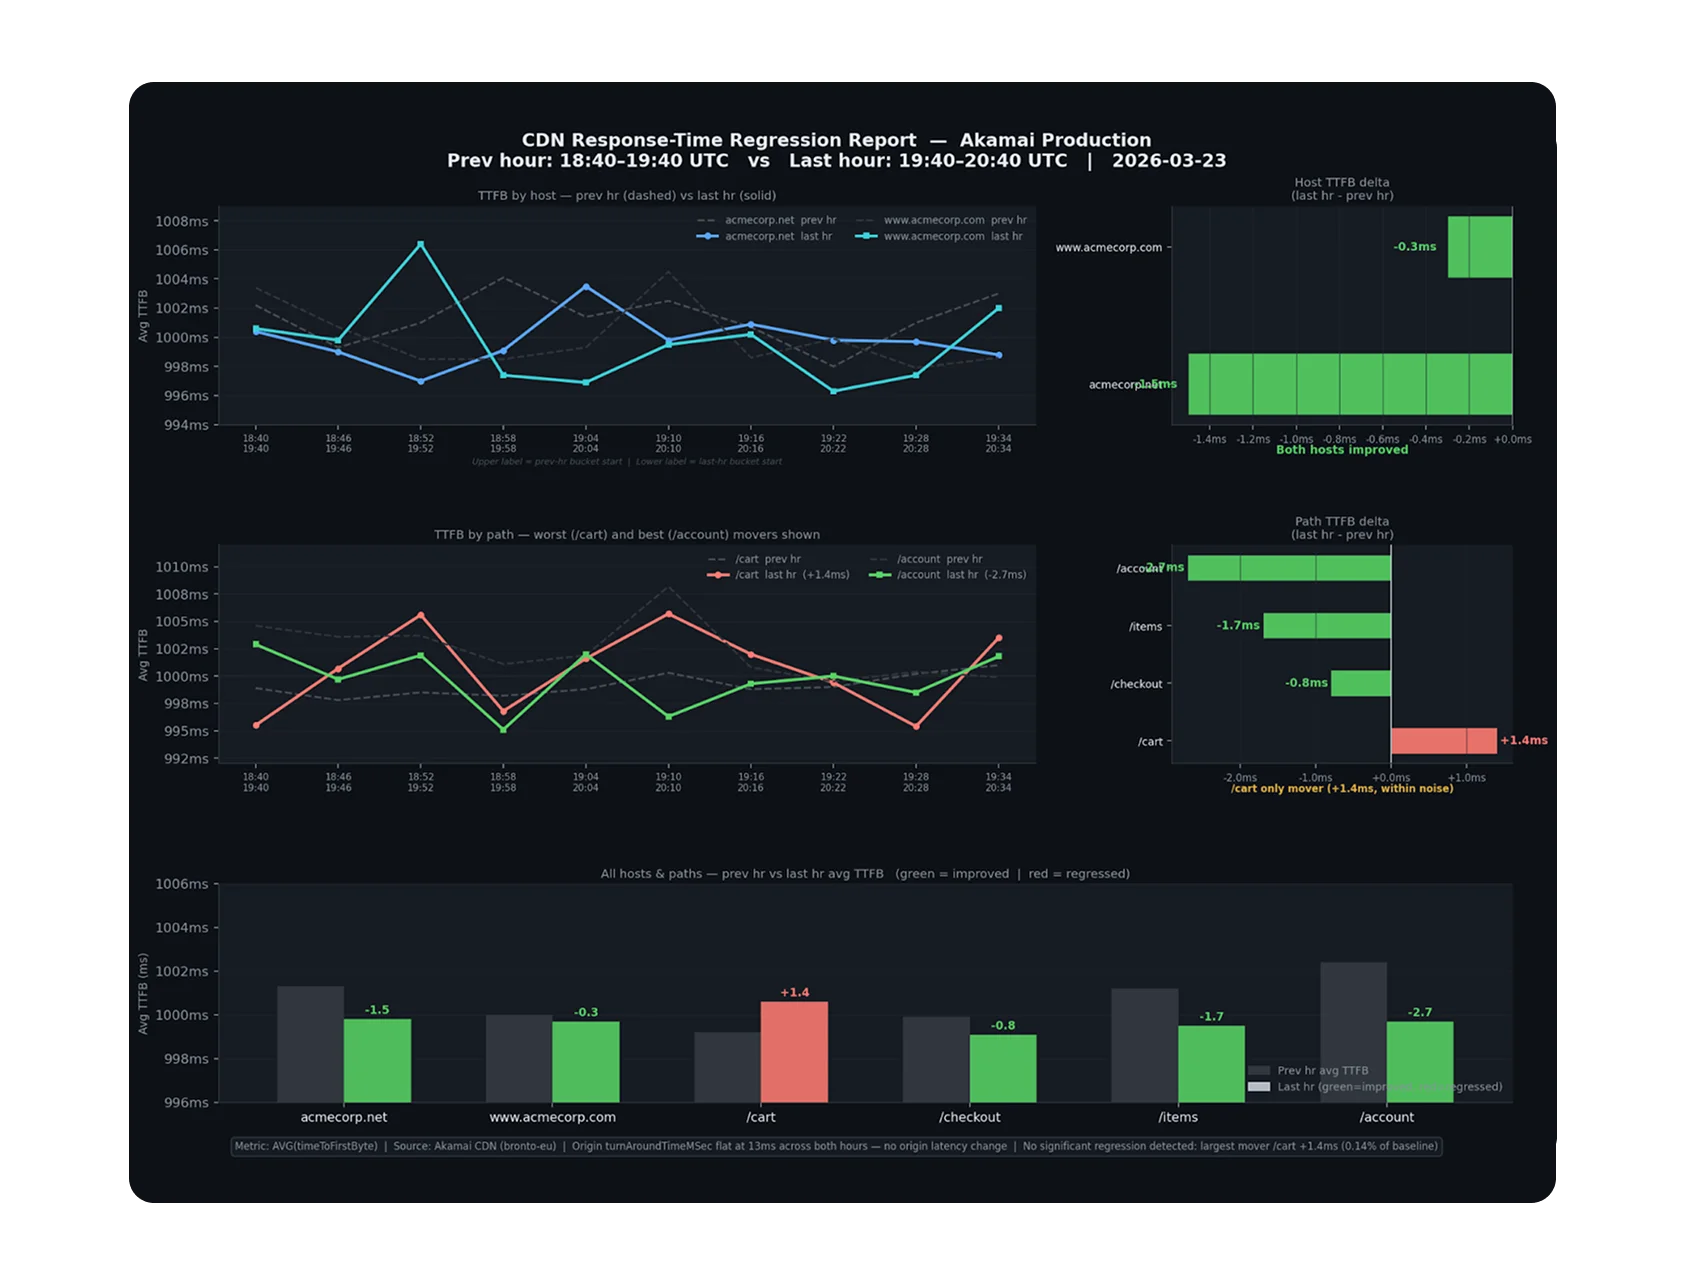
Root Cause Analysis Report
Generated: May 06, 2026 17:26:00 Window: Apr 29 → May 06
1. Analysis
Primary Issue
Sustained, high-volume backend receive errors (BG-ERROR-RECV) returning HTTP 503 across the API fleet.
Scope Description
- Total errors: ~7.1M across the 7-day window, 20 buckets
- Volume is consistently massive — ~343K to ~371K per bucket, indicating a chronic, systemic failure
- Signature (
BG-ERROR-RECV, HTTP 503) points to Fastly edge failing to receive a valid response from origin (api.host78.us.example.com) - Protocol anomaly:
request_protocol: "UDP"— invalid for HTTP API endpoint - Edge:
fastly_is_edge: true— failure at edge tier before app layer - Response time: 3643ms — requests stalling at backend before drop
- Trend: slight decline mid-window (Apr 30–May 02 ~360K) then rebounding sharply (May 05–06 ~371K) — worsening
2. Hypothesis & Next Steps
Probable Cause
Backend origin servers behind Fastly are failing to handle TCP connections reliably — likely origin pool exhaustion, a crashing upstream, or a network-level issue preventing edge nodes from completing the handshake. The UDP protocol field suggests either malformed requests forwarded to origin (misconfigured VCL) or a logging pipeline bug masking the true protocol.
Immediate Next Steps
- Investigate the UDP anomaly at Fastly. Review VCL config for
api.host78.us.example.com; pull real-time logs filtered tocache-iad-kcgs_*to check if errors concentrate on specific PoPs (especially IAD). - Assess origin server health. Check CPU, memory, file descriptors, and connection queue depth. Review app logs from May 05 17:00 → May 06 17:26 for crash loops, OOM events, or dependency failures.
Report confidence: High — volume consistency and error signature indicate a reproducible failure mode requiring parallel edge and origin investigation.
Related queries
- service:api status:503 host:"api.host78.us.example.com"
- fastly_is_edge:true error_code:BG-ERROR-RECV
- pop:cache-iad-kcgs_* response_time:>3000
[Bronto] Investigation Report · New org created in US
A new organization was created in the US which triggered the "New org created in US" monitor. Trial setup completed successfully and no anomalies or service issues were detected.
The monitoring workflow detected the creation of a new organization in the US region and automatically generated an investigation report. The system successfully created the organization, customer account, user account, and trial limits without interruption.
This investigation was triggered intentionally by the "New org created in US" monitor. The monitor notifies the team whenever a new trial organization is provisioned in production. The behavior matches expected onboarding activity.
No immediate action is required. Recommended follow-up: validate welcome email delivery, monitor early ingestion activity, and confirm billing and trial entitlements remain correctly applied over the next 24 hours.
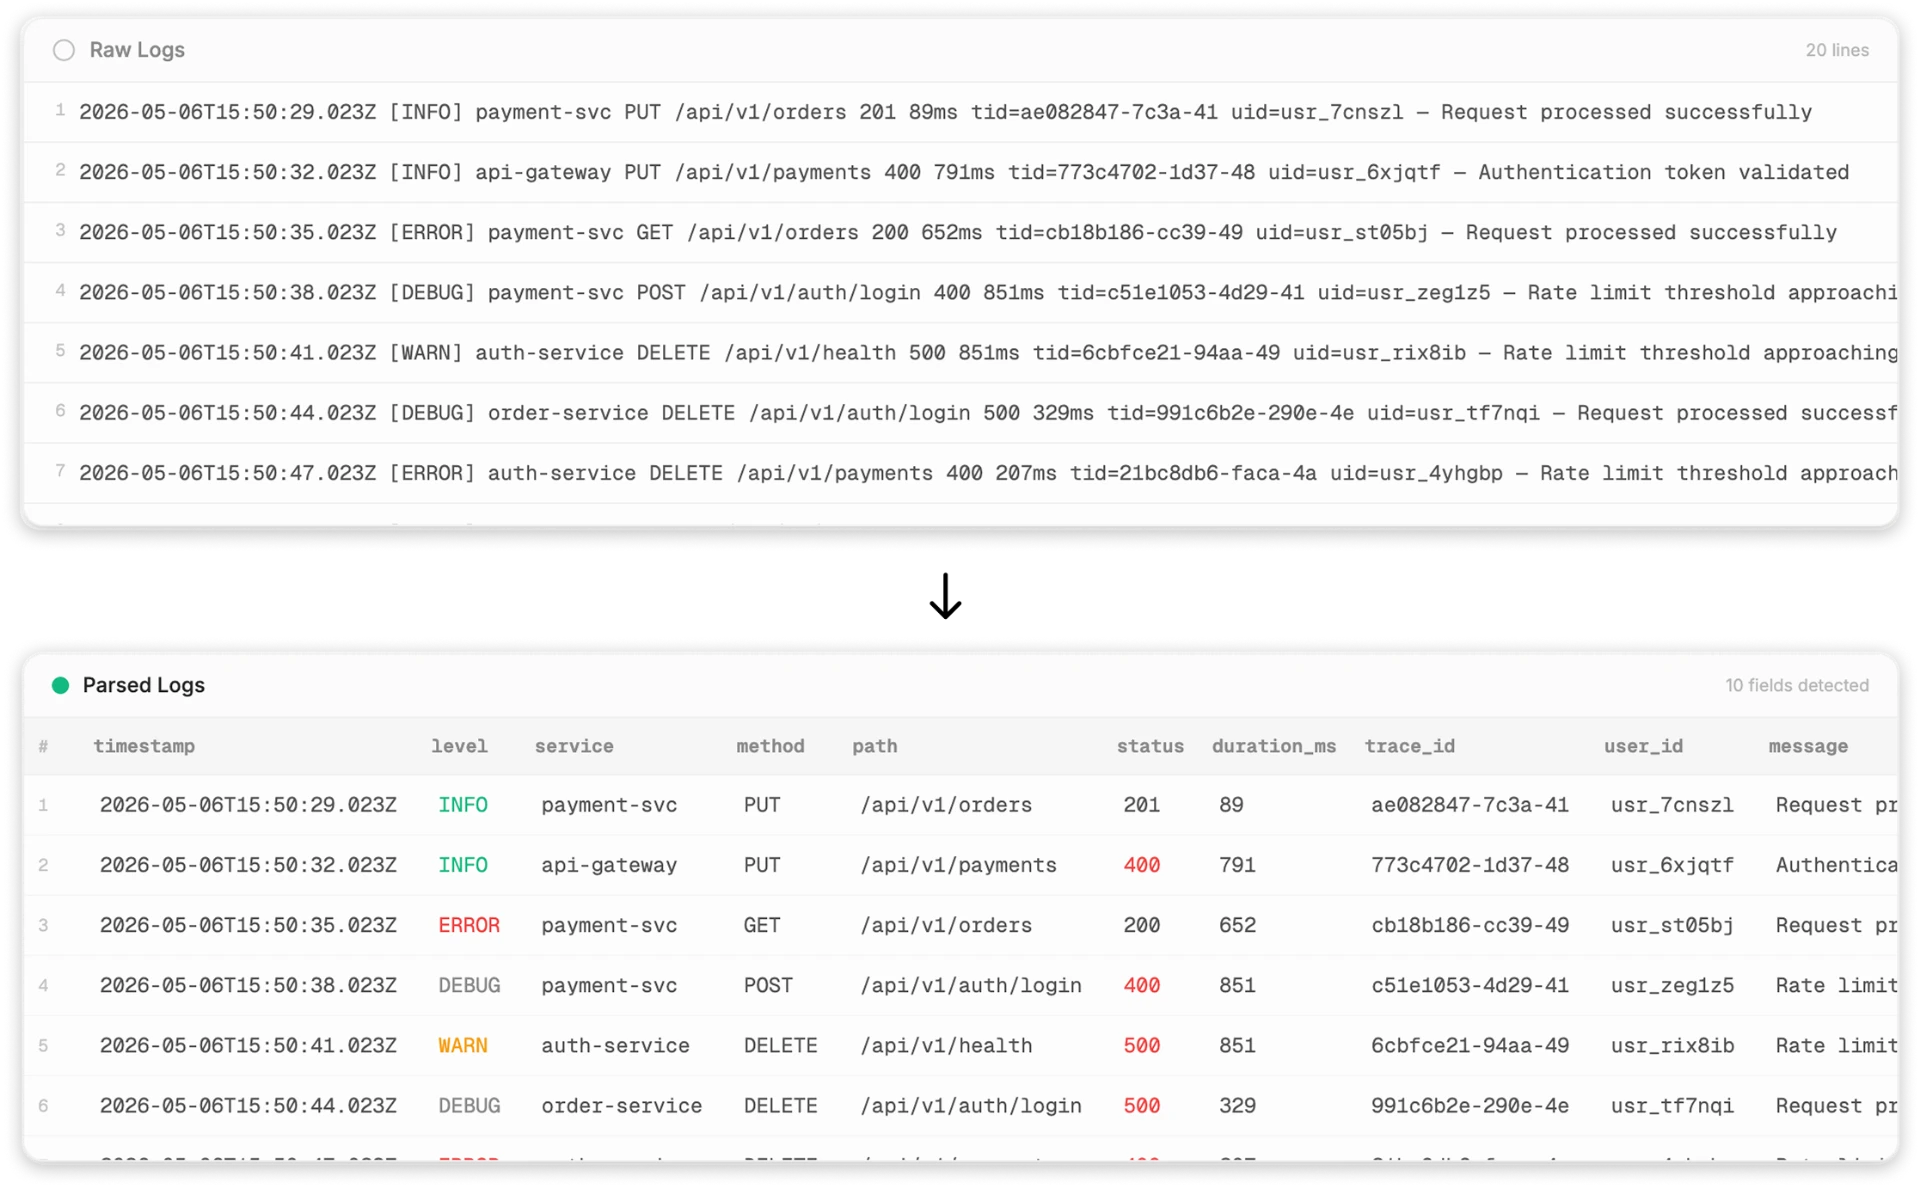
| # | timestamp | level | service | method | path | status | duration | trace_id | user_id | message |
|---|---|---|---|---|---|---|---|---|---|---|
| 1 | 2026-05-06T15:50:29.023Z | INFO | payment-svc | PUT | /api/v1/orders | 201 | 89 | ae082847-7c3a-41 | usr_7cnszl | Request processed successfully |
| 2 | 2026-05-06T15:50:32.023Z | INFO | api-gateway | PUT | /api/v1/payments | 400 | 791 | 773c4702-1d37-48 | usr_6xjqtf | Authentication token validated |
| 3 | 2026-05-06T15:50:35.023Z | ERROR | payment-svc | GET | /api/v1/orders | 200 | 652 | cb18b186-cc39-49 | usr_st05bj | Request processed successfully |
| 4 | 2026-05-06T15:50:38.023Z | DEBUG | payment-svc | POST | /api/v1/auth/login | 400 | 851 | c51e1053-4d29-41 | usr_zeg1z5 | Rate limit threshold approaching |
| 5 | 2026-05-06T15:50:41.023Z | WARN | auth-service | DELETE | /api/v1/health | 500 | 851 | 6cbfce21-94aa-49 | usr_rix8ib | Rate limit threshold approaching |
| 6 | 2026-05-06T15:50:44.023Z | DEBUG | order-service | DELETE | /api/v1/auth/login | 500 | 329 | 991c6b2e-290e-4e | usr_tf7nqi | Request processed successfully |
| 7 | 2026-05-06T15:50:47.023Z | ERROR | auth-service | DELETE | /api/v1/payments | 400 | 207 | 21bc8db6-faca-4a | usr_4yhgbp | Rate limit threshold approaching |
| 8 | 2026-05-06T15:50:50.023Z | INFO | api-gateway | POST | /api/v1/orders | 201 | 142 | f47ac10b-58cc-4a | usr_k3m9wp | Authentication token validated |
| 9 | 2026-05-06T15:50:53.023Z | WARN | payment-svc | GET | /api/v1/payments | 200 | 998 | b7d2c891-3f12-49 | usr_8nv2qs | Request processed successfully |
| 10 | 2026-05-06T15:50:56.023Z | ERROR | auth-service | PUT | /api/v1/health | 500 | 412 | a92e0c14-9b88-4d | usr_pl4xtb | Rate limit threshold approaching |
| 11 | 2026-05-06T15:50:59.023Z | INFO | order-service | POST | /api/v1/orders | 201 | 76 | 5e1f8a73-2c44-41 | usr_q9c1zr | Request processed successfully |
| 12 | 2026-05-06T15:51:02.023Z | DEBUG | payment-svc | GET | /api/v1/payments | 200 | 583 | c2d9b6e0-7f33-48 | usr_h7d3yf | Authentication token validated |
| 13 | 2026-05-06T15:51:05.023Z | INFO | api-gateway | DELETE | /api/v1/auth/login | 400 | 921 | e8b4f3a1-4d28-42 | usr_b2x8mn | Rate limit threshold approaching |
| 14 | 2026-05-06T15:51:08.023Z | WARN | auth-service | PUT | /api/v1/health | 500 | 305 | 3a7c9d2e-1b55-4f | usr_v4w6ks | Request processed successfully |
| 15 | 2026-05-06T15:51:11.023Z | ERROR | payment-svc | POST | /api/v1/orders | 201 | 188 | 8f2e1a6c-9c77-43 | usr_j1n5pq | Authentication token validated |
| 16 | 2026-05-06T15:51:14.023Z | INFO | order-service | GET | /api/v1/payments | 200 | 754 | d4b8e7f0-3a99-45 | usr_t8r2lc | Request processed successfully |
| 17 | 2026-05-06T15:51:17.023Z | DEBUG | api-gateway | PUT | /api/v1/auth/login | 400 | 432 | 1c5b9e8d-6e22-4a | usr_g6f9hd | Rate limit threshold approaching |
| 18 | 2026-05-06T15:51:20.023Z | INFO | payment-svc | DELETE | /api/v1/health | 500 | 611 | 9b3d6f2a-8c11-49 | usr_m3e7vb | Request processed successfully |
| 19 | 2026-05-06T15:51:23.023Z | WARN | auth-service | POST | /api/v1/orders | 201 | 95 | 7e2a4b1c-5d66-48 | usr_y5u1xa | Authentication token validated |
| 20 | 2026-05-06T15:51:26.023Z | ERROR | order-service | GET | /api/v1/payments | 200 | 488 | 2f8c1d9e-4b33-47 | usr_o2k4wn | Request processed successfully |
Loved by teams
around the world
“Bronto fundamentally changed how we think about logging. We went from treating logs as a necessary evil — expensive, unreliable, and limited — to making them a key asset. The combination of unlimited retention, lightning-fast search, and AI-powered insights means we catch issues much earlier, often before customers notice them. But the real transformation is cultural: every team now has access to the data they need, when they need it.”

Paul Griffin
Head of Platform Engineering
“Bronto's long-term always-hot days mean we can access data with sub-second search, whether it's from last week or last year. This is huge for our security and AI strategy as we continue to revolutionize how we work at Nitro. For AI-powered analysis of our logs, data availability is key — it's just not possible with only a few days of retention. Bronto has become a key part of our toolkit when we think of log data and how it will play an important role for engineering, security and product teams going forward.”

John Fitzpatrick
CTO
“Tasks that used to take 15 minutes are now almost instant. I find myself using Bronto much more than the previous tool simply because it's faster and more responsive. I can quickly ask questions and get immediate answers, which makes it easier to explore insights that were previously hard to uncover. With a year's worth of data retention instead of just 90 days, I can now identify annual trends and patterns I couldn't see before. This extended retention opens the door for much deeper analytics.”

Brian Elliott
Senior Engineering Manager, SaaS Services
“It's a night and day difference to our previous logging provider. Bronto typically returns results in seconds, while our old vendor took over 30 minutes and frequently failed to render visualizations. Bronto has come a long way with everything from usage to UI. Our users are getting what they're looking for.”

Jaymin Patel
Team Lead
“Bronto helped us cut costs and centralize our multi-cloud application logging, as well as providing cost-effective 12 month retention for billing-related events. Troubleshooting is now significantly faster, and having all our logs correlate properly in one place has been a game-changer for our team.”

Joaquín Sargiotto
DevOps Team Lead
“The TCO reduction is significant — we're saving hundreds of thousands annually. But the real value is in new and significantly enhanced capabilities. A significant reduction in time to root cause, investigating issues from months ago, having logs actually available during incidents — these aren't just improvements, they're game-changers. Our SysOps team now get to work on platform innovation instead of keeping Graylog alive.”
Aodh O'Mahony
Engineering Manager
“Bronto fundamentally changed how we think about logging. We went from treating logs as a necessary evil — expensive, unreliable, and limited — to making them a key asset. The combination of unlimited retention, lightning-fast search, and AI-powered insights means we catch issues much earlier, often before customers notice them. But the real transformation is cultural: every team now has access to the data they need, when they need it.”
Paul Griffin
Head of Platform Engineering
“Bronto's long-term always-hot days mean we can access data with sub-second search, whether it's from last week or last year. This is huge for our security and AI strategy as we continue to revolutionize how we work at Nitro. For AI-powered analysis of our logs, data availability is key — it's just not possible with only a few days of retention. Bronto has become a key part of our toolkit when we think of log data and how it will play an important role for engineering, security and product teams going forward.”
John Fitzpatrick
CTO
“Tasks that used to take 15 minutes are now almost instant. I find myself using Bronto much more than the previous tool simply because it's faster and more responsive. I can quickly ask questions and get immediate answers, which makes it easier to explore insights that were previously hard to uncover. With a year's worth of data retention instead of just 90 days, I can now identify annual trends and patterns I couldn't see before. This extended retention opens the door for much deeper analytics.”
Brian Elliott
Senior Engineering Manager, SaaS Services
“It's a night and day difference to our previous logging provider. Bronto typically returns results in seconds, while our old vendor took over 30 minutes and frequently failed to render visualizations. Bronto has come a long way with everything from usage to UI. Our users are getting what they're looking for.”
Jaymin Patel
Team Lead
“Bronto helped us cut costs and centralize our multi-cloud application logging, as well as providing cost-effective 12 month retention for billing-related events. Troubleshooting is now significantly faster, and having all our logs correlate properly in one place has been a game-changer for our team.”
Joaquín Sargiotto
DevOps Team Lead
“The TCO reduction is significant — we're saving hundreds of thousands annually. But the real value is in new and significantly enhanced capabilities. A significant reduction in time to root cause, investigating issues from months ago, having logs actually available during incidents — these aren't just improvements, they're game-changers. Our SysOps team now get to work on platform innovation instead of keeping Graylog alive.”
Aodh O'Mahony
Engineering Manager