Naming Is Hard… Except at Bronto
Sept 12, 2025
There are 2 hard problems in computer science: cache invalidation, naming things, and off-by-1 errors. -- Leon Bambrick
In an observability platform like Bronto, every monitor and log you create needs a name and a short description. Those fields are far from trivial, they are critical to the engineer who receives the alert (often at 3:00 AM, having never seen the monitor before). A good name and description provide just enough context to quickly understand:
- What went wrong
- How severe it is
- Whether it can wait until morning or must be fixed immediately
Poorly named or inconsistently named monitors force engineers to dig deeper just to understand the basics. This leads to confusion, misclassification, wasted time and makes the system harder to maintain over time.
Sounds simple, right?
Not quite.
In reality, monitors are created by many different people, with different naming styles, different levels of context, and varying experience. The result: a naming mess.
Good vs. Bad Monitor Names
So what does a good monitor name look like? Here are some best practices we follow at Bronto:
Good Naming practices
- Specific and descriptive: Clearly indicates what is being monitored and under what condition.
Example: DB-Cluster-1 Disk Usage > 80%
- Properly scoped: Includes the service, component, or environment.
Example: Production Kafka Lag > 60s
- Includes thresholds: Makes the triggering condition explicit.
Example: API Gateway 5xx Error Rate > 10%
- Consistency: Uses the same naming style across all monitors.
Example: [Service] [Metric] [Condition]
Things to Avoid
- Vague or generic: Increase in errors - tells you very little.
- Overly technical: DB_PROC_24 failed - Internal IDs or cryptic codes confuse everyone but the author.
- Missing context: High CPU - doesn’t say which service or when it matters.
- Abstract: Something bad happened - provides no actionable insight.
- Unfamiliar language: Problème détecté - adding a language translation step only slows down resolution.
What We Found in Monitors
When we audited all monitors across customers in our EU region, we discovered:
- 44% had good, descriptive names
- 56% were problematic
Breaking down the problematic ones:
- 32% used placeholder names
- 25% were vague or generic
- 18% were overly technical
- 20% had missing context
- 5% contained personal names (!)
Clearly, we needed to reduce user toil and make naming easier and more consistent.
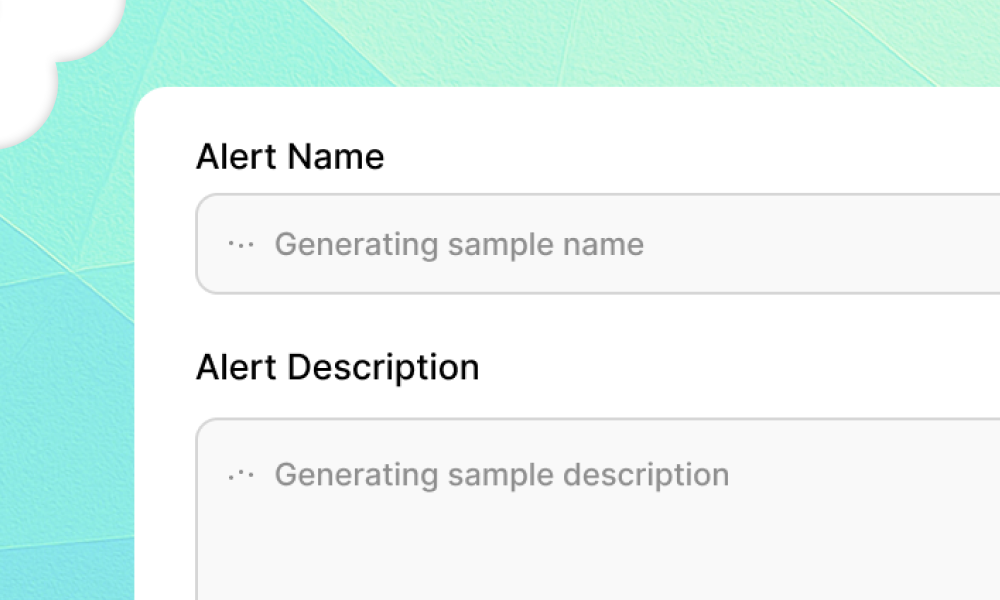
AI-Assisted Naming and Descriptions
At Bronto, we decided to let AI take care of this problem.
When a user creates a monitor, they configure sources, filters, thresholds, and alert destinations. Traditionally, other tools then make you manually name and describe the monitor.
We flipped that workflow around.
Here’s what happens in Bronto:
- We gather the names of all existing monitors in your organization (to understand your naming style).
- We add the monitor context: collection and dataset names, filter, and threshold.
- We send this data to a Bronto AI service that uses an AWS Bedrock LLM, which generates a name and description suggestion.
This happens in 2–3 seconds, and the result is shown automatically, the user is free to tweak it before saving. This approach removes a little bit of toil, but more importantly, it produces consistent, descriptive names that make monitors easier to understand and act on.
Examples
| Collection:Dataset | Filter | Threshold | Suggested Name | Suggested Description |
|---|---|---|---|---|
| Akamai:cdn | "cacheStatus"='0' AND "country"='US' |
20 | US CDN Cache Miss Rate High | Alerts when cache misses (cacheStatus=0) for US traffic exceed 20, indicating cache efficiency issues. |
| web:access.log | "method"='POST' AND "status">500 |
100 | High POST Error Rate | Alerts when POST requests returning 5xx errors exceed 100, indicating a potential API or backend failure. |
| ingestion:ingestion_gc | "event"='Pause Full' AND "duration">2000 |
5 | Ingestion GC Pause Full Duration | Monitors when ingestion GC Pause Full events exceed 2000 ms more than 5 times. |
| .usage:search | "event_type"='search_usage' AND "bytes_total">1000000000 |
1 | Large Search Query Detected | Alerts when a search query exceeds 1 GB, indicating resource-heavy or unusual activity. |
Powered by AWS Bedrock
Just like our AI-Generated Parsing and Brontoscope features, this capability uses AWS Bedrock, which gives us access to the latest large language models without requiring us to manage infrastructure or tune models manually.
Looking Ahead
At Bronto, we believe AI should remove pain points and reduce toil. Auto-naming and automatic description generation are perfect examples of that philosophy in action.
In the near future, we plan to expand this feature to every name and description text input in the product, including saved views and dashboards, so naming things consistently becomes effortless.
Find out more?
Our AI features\
\
![]() Customer Success Story\
\
Customer Success Story\
\
![]() Compare to others\
\
Compare to others\
\
![]()
Read more blogs
Learn about Bronto and logging best practices.

Bronto Hosted MCP Server
April 1, 2026

Introduction to A2A and agent search
Mar 27, 2026
Bronto for Fastly: Real-time CDN logging that actually scales
Mar 18, 2025
Log more, spend less.
The complete platform for high-volume, anytime logs.