Your LLM Logs Deserve Better · Send Them to Bronto
Conall Heffernan
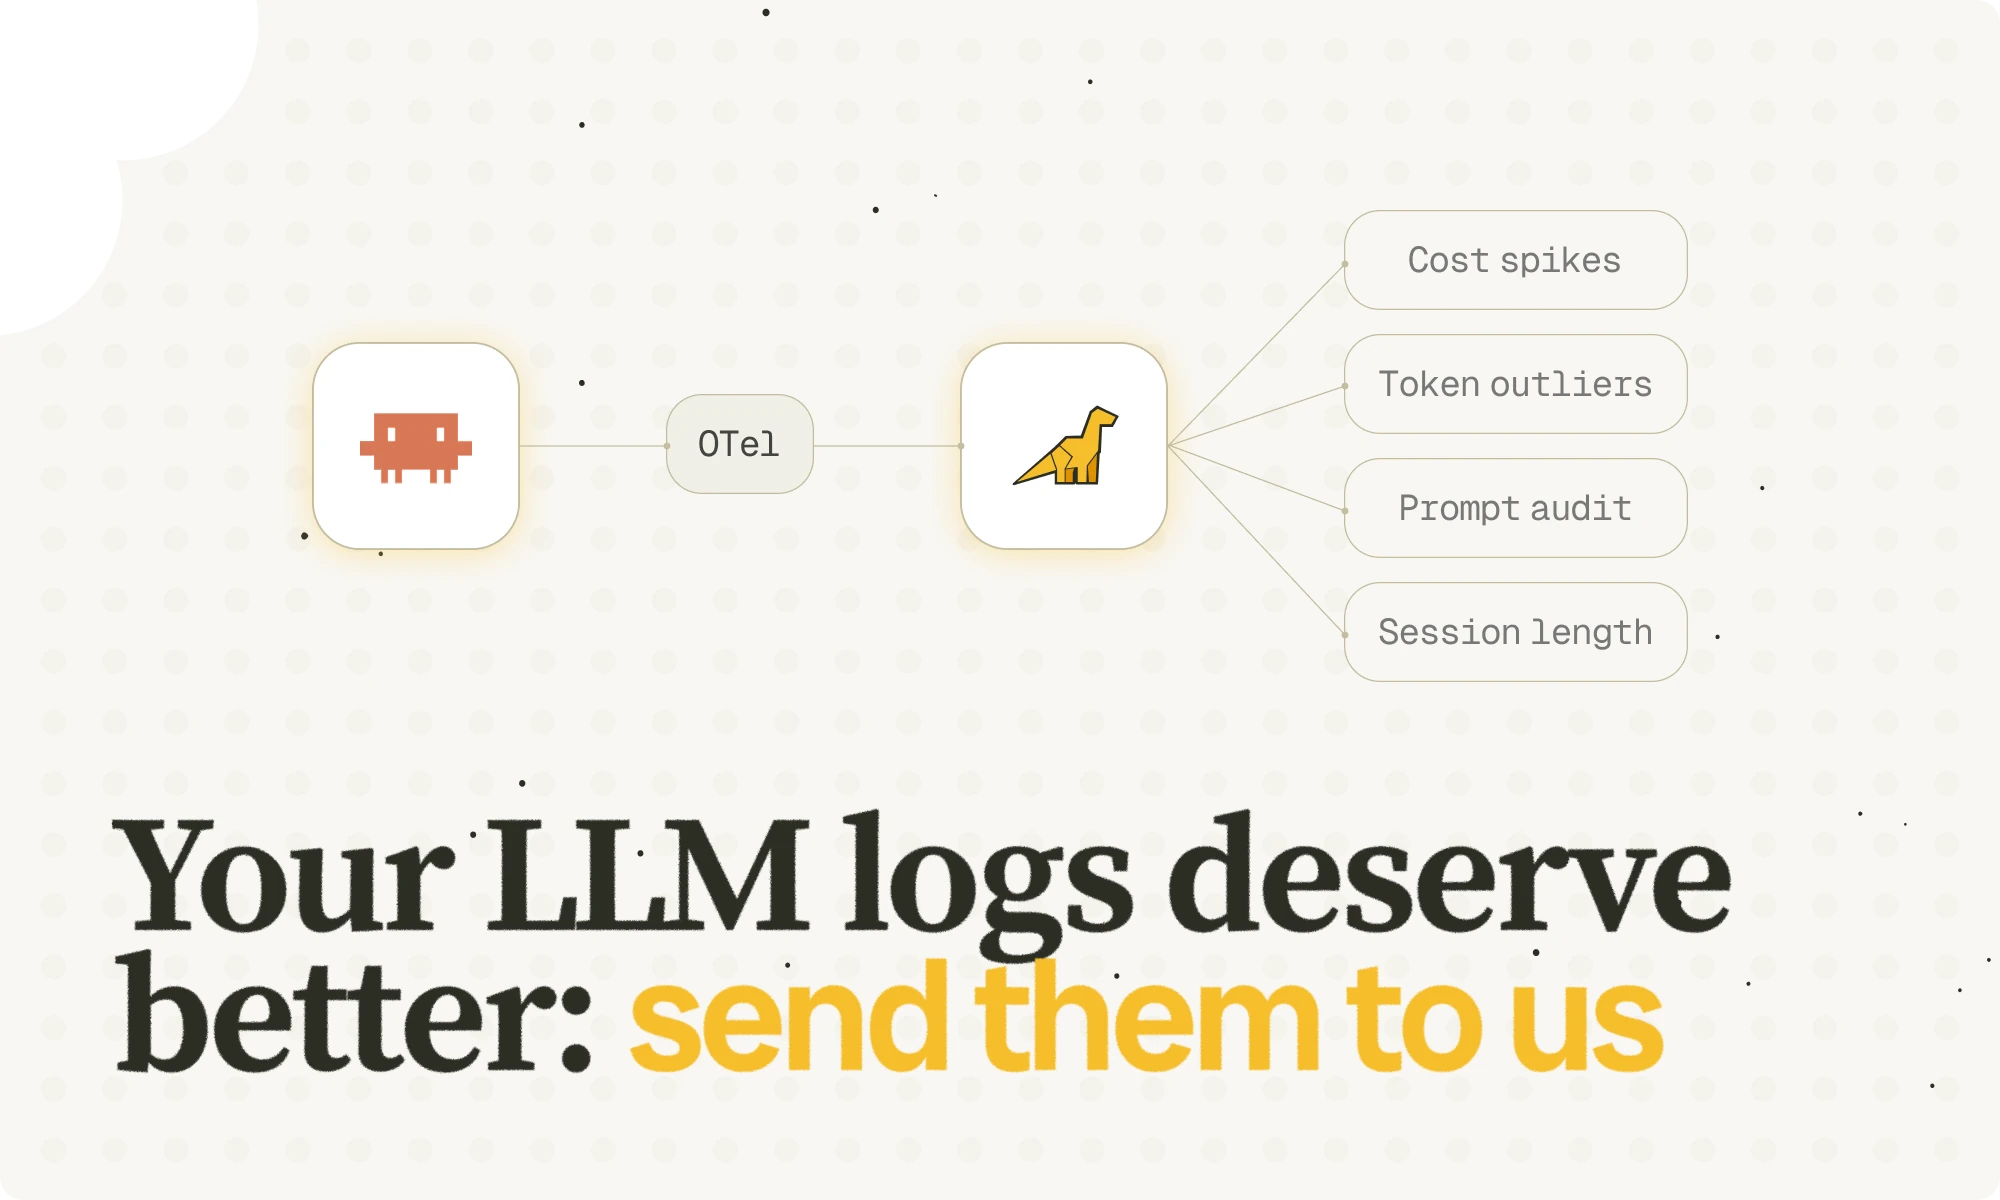
In this post, we’ll walk through how to integrate Anthropic’s Claude Code monitoring with Bronto so you can get a clear, unified view of your usage — all in one place. Each interaction generates structured log events that capture things like token counts, latency, and metadata. This project came out of our recent company AI sprint as outlined in this blog — a chance for me as a technical support manager, to jump into an engineering sprint and brush up on my Python and Bash skills. After years of helping customers set up and troubleshoot their environments, it was exciting to get hands-on spinning up a sandbox and demoing my findings to the wider team over pizza and beers.
What can you send from Claude Code to Bronto?
Claude Code offers a useful monitoring feature, which gives a detailed view into how your teams use and benefit from AI-assisted coding — from productivity metrics to cost visibility. When paired with Bronto, this data becomes even more useful.
Here’s what you can do with the exported data:
- Understand usage patterns: Analyse how different users and teams engage with Claude Code over time.
- Measure productivity: Track metrics like lines of code modified and models used to see how work gets done.
- Monitor costs: Get a clear picture of spend by team, user, or session using their monitoring exports.
- Audit Prompts - See how users are interacting with your model — what they’re asking, building, or automating. Tracking this data helps you identify common use cases, detect misuse, and refine prompts or model behavior based on real-world usage.


Here’s why your Anthropic logs belong in Bronto:
-
Centralise all event logging across your organisation for unified analysis.
-
Visualise more, effortlessly — create dashboards using our AI widget creator so you don’t even need to write queries anymore - see our recent post about this
-
Set up monitors to alert on:
- Sudden spikes in cost
- Unusual token usage
- High session volumes from specific teams or users
-
Powerful, fast Search: Easy-to-use and fast, scalable querying lets you explore and investigate your LLM logs.
-
Handle High Volume Easily: LLM tools like Ollama ( see previous post) and Claude Code can generate massive, detailed logs. Bronto’s optimised storage and query engine make it easy to handle high-volume, high volume events without breaking your budget.
-
Long term retention: Bronto provides 12 months of hot logs as default, allowing you to maintain, analyse and search your logs whether from the last 10 seconds or 10 months. Long term access to LLM logs is becoming more important from support (e.g. keeping track of specific prompts), operations (given then non deterministic nature of LLMs) as well as regulatory and compliance reasons.
Bridging Claude Code and Bronto
Bronto integrates seamlessly with pretty much everything.If your agent or library can send data over HTTP, you can point it straight at our ingestion endpoints and you’re good to go.
Let's look at the 2 options for sending logs to Bronto:
Option 1: Direct
Claude Code has built-in OTel support, which means it can send telemetry data straight to Bronto. If you’re starting fresh, this is the simplest way to connect Claude to Bronto. Full details are outlined on their docs
All you need to do is set a few environment variables:
With this setup, Claude Code will send structured logs directly to Bronto without needing to run or maintain any additional infrastructure.
This approach is ideal if:
- You’re running Claude Code locally or in a single environment
- You don’t already use a centralised OTel collector
- You want a lightweight, zero-maintenance integration
Option 2: Using an Existing OTEL Collector
If your organisation already runs an OTEL Collector, you can route Claude Code’s logs through that same pipeline before sending them to Bronto.
This is the setup I used for my project. I spun up a small AWS EC2 instance running the OTEL collector, configured Claude Code to send logs to it, and had the collector forward those logs to Bronto.
Claude Code sends data to the collector using the same environment variables, but this time the endpoint points to localhost. Just don’t forget to persist them, or you’ll end up like me (a non-dev) wondering why nothing worked the next day when starting a new session cleared them.
And here’s a sample collector config snippet that listens for those events
This method gives you the flexibility to:
- Aggregate logs from multiple sources before forwarding
- Apply processors like filters
- Keep your Bronto exporter config in one place
Starting Claude to generate log data
To make sure everything was working, I ran a quick test. I fired up Claude Code and asked it to create a simple Python script. Then I asked it to make a few tweaks, spin up a basic GUI, take an input value, and save it locally. While I was doing all that, Claude Code was busy doing the work and generating log events in the background which flowed through my OTEL collector and straight into Bronto. Easy visibility, end to end.

Searching Claude logs in Bronto
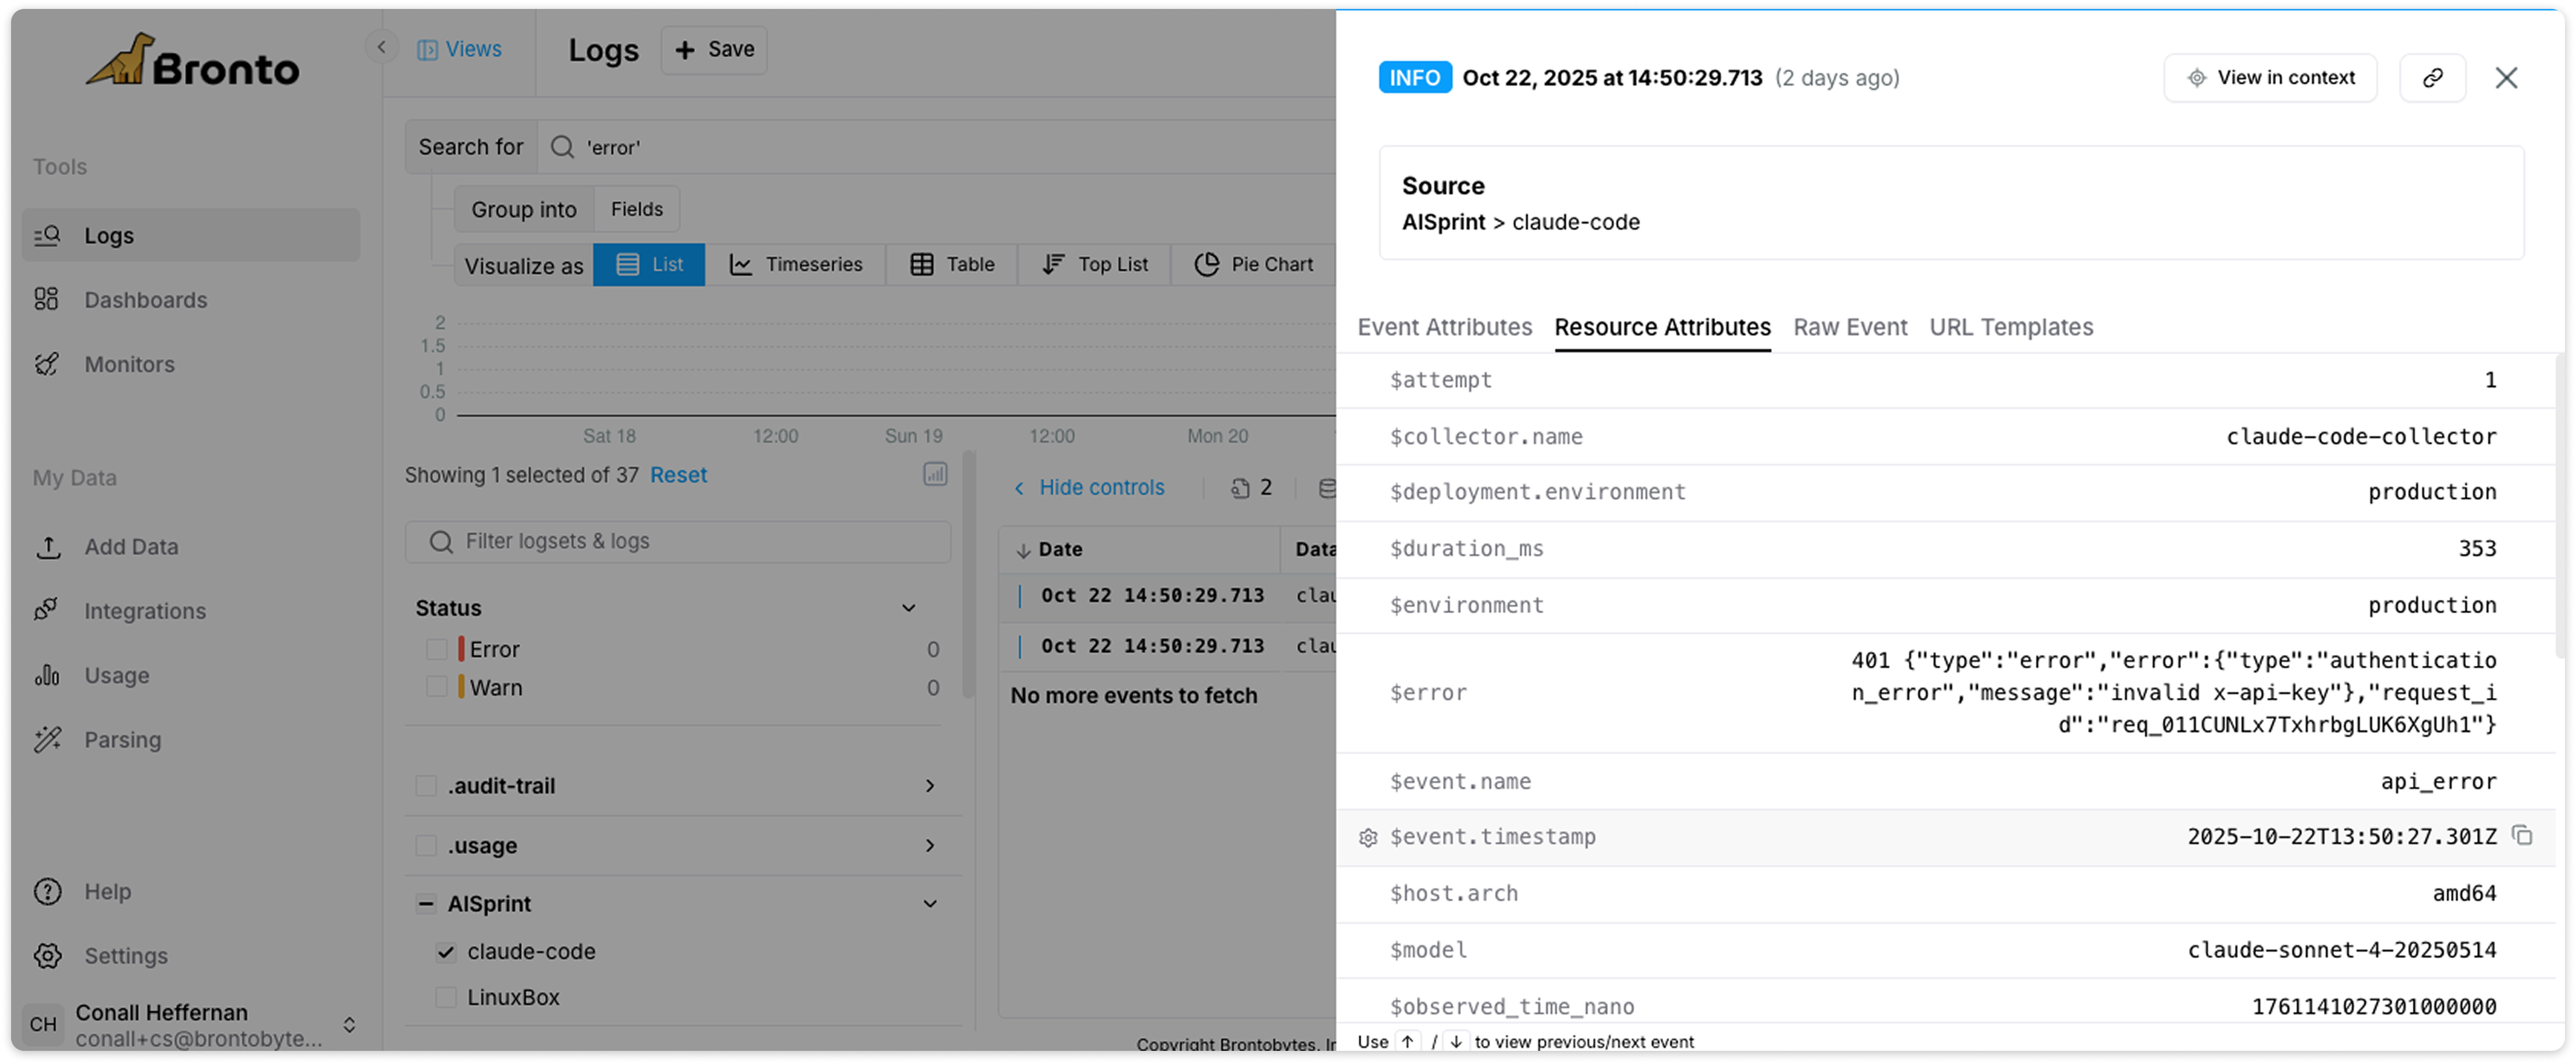
Claude was having issues because it was using my old Claude API key from a previous project. I remembered that I had revoked this key but hadn’t updated it. While the UI displayed an error, I was also able to see the API errors sent to Bronto thanks to the setup from the earlier steps. By running a simple ‘error’ query, I could review the logs directly. On a larger scale, we could set up alerts on this data or even visualise it in dashboards.
I also ran a search and created a tree map to instantly visualise which models were used in this project. This makes it easy to see usage patterns and identify which models were used more heavily in your environment.

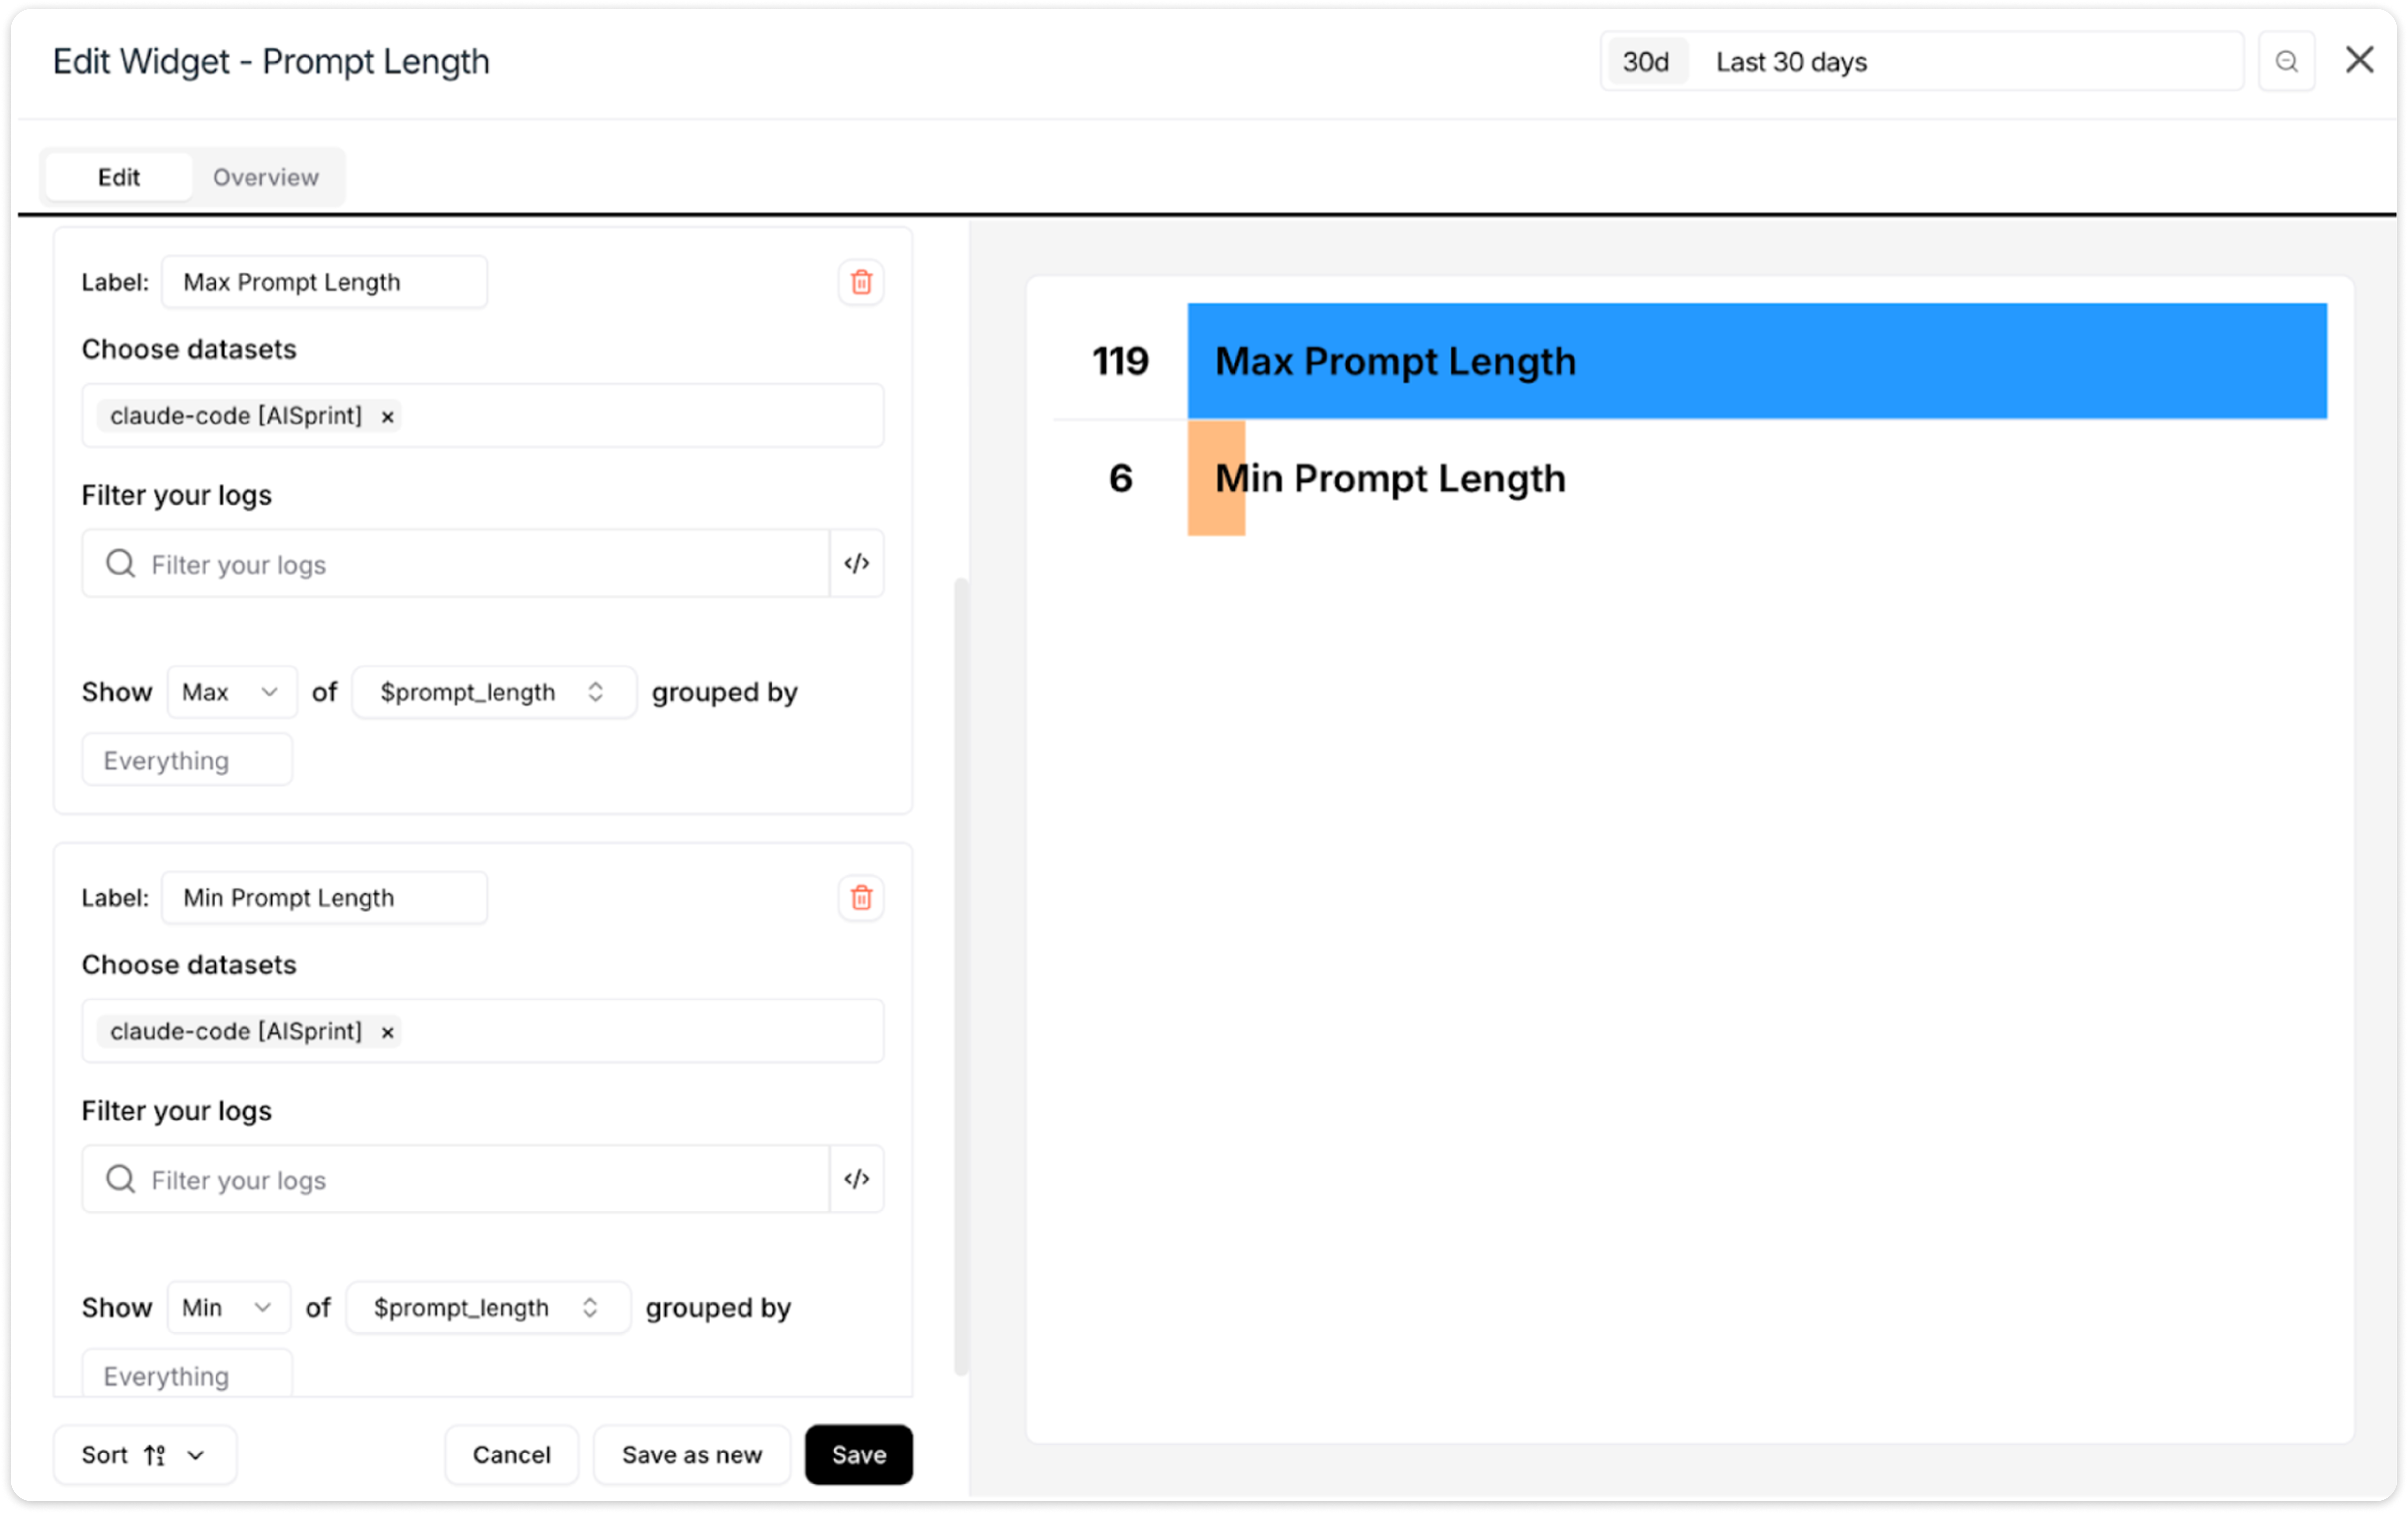
Or let’s take a closer look at token usage by identifying potential outliers. One effective approach is to perform a multi group-by analysis on both $input_tokens and $output_tokens. Tracking input and output tokens is useful for managing LLM performance and cost. By monitoring token usage, teams can identify inefficient prompts, control API spend, and uncover latency trends tied to model size or context length.

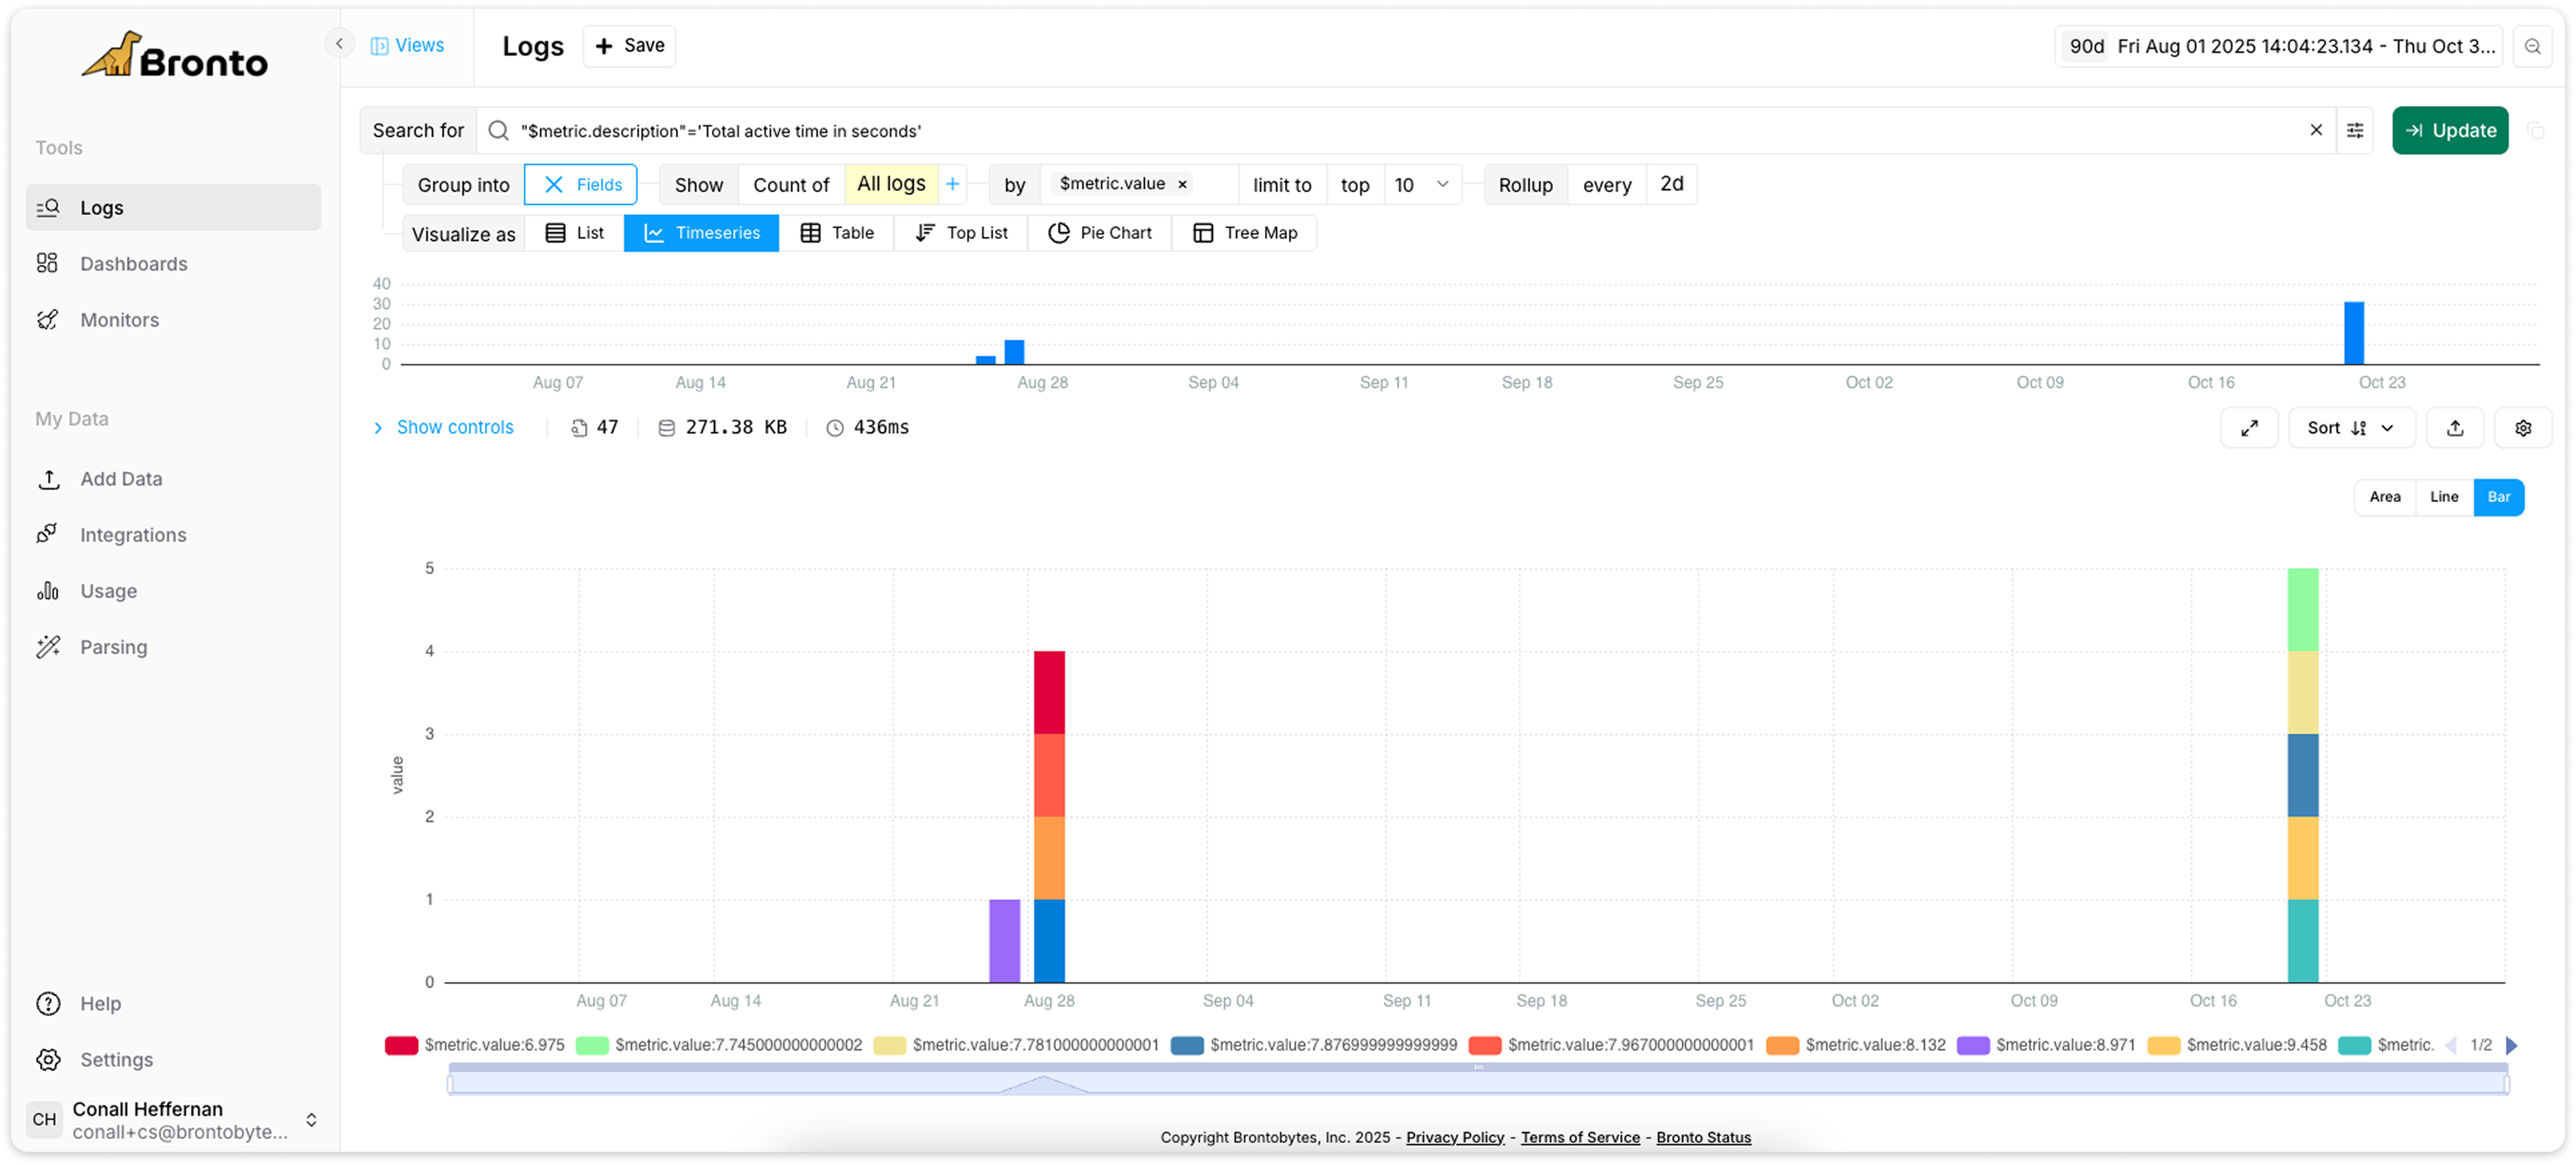
Another example would be seeing how long each session stayed active, measured in seconds, to identify any outliers over time. Tracking session duration helps identify inefficient workflows, idle connections, or requests that hang, which can inflate costs and reduce throughput. It’s also a great signal for user engagement and latency trends, shorter sessions might mean quick completions, while longer ones can point to complex prompts or slow model responses.
What about auditing prompts and viewing these as an events list? Since these logs are redacted by default, make sure to enable them by setting the following environment variable: OTEL_LOG_USER_PROMPTS=1.
Conclusion
And that’s it, from Claude Code to Bronto, all connected through OpenTelemetry. Once it’s set up, you get visibility into how your AI tool is being used, cost metrics, and what’s actually happening under the hood.
It’s a simple setup, requiring setting a few env vars (that you remember to persist), an open source agent and you will have logs and insights flowing into Bronto.
Try sending your first Claude logs to Bronto today and experience how fast it is to search those logs and get insights into your Claude usage - you will see why LLM logs need Bronto as the logging layer, as it has been specifically designed for fast search and large volumes of logs.
Start a Free Trial of Bronto
Try Bronto for free for 14 days to see how easily you can send, store, and search logs from Claude.
Start a Free Trial of Bronto →
Appendix
Sample Otel Config:
exporters:
pipelines:

Try Bronto free for 14 days
Centralize your agent and infrastructure telemetry in one platform with sub-second search and 12-month hot retention. No credit card required.