
.png)
Every logging platform has to solve the same fundamental problem: when a query arrives, how do you avoid scanning data you don't need? The answer determines your search performance, your costs, and how much friction you create for the engineers sending you logs.
We've thought hard about this at Bronto, and we want to walk you through how we partition data at ingestion as part of this approach – what we’ve built, why we made the tradeoffs we did, and where we landed with the new Partition Tags feature.
The spectrum of approaches
There are broadly two schools of thought on log data organization.
At one end, you have label-heavy systems like Loki. Everything searchable is a label, and labels determine how data is physically partitioned. The appeal is obvious – you can filter on anything – but the problem is cardinality. Labels with too many distinct values may fragment your data into thousands of tiny chunks. Loki's own documentation warns about this: high cardinality blows up the index size and causes constant small flushes to object storage. Your search performance degrades precisely as your data gets more interesting.
At the other end, you have platforms that keep everything in one big bucket and rely on their query engine to brute-force through it. There's no concept of user-defined data partitioning which makes it convenient and it works because they've invested heavily in query performance. But you pay for that convenience – every query scans more data than it needs to.
We wanted something in the middle: efficient partitioning that doesn't require you to design your data model upfront or become a cardinality expert before you can send your first log.
How Bronto structures data
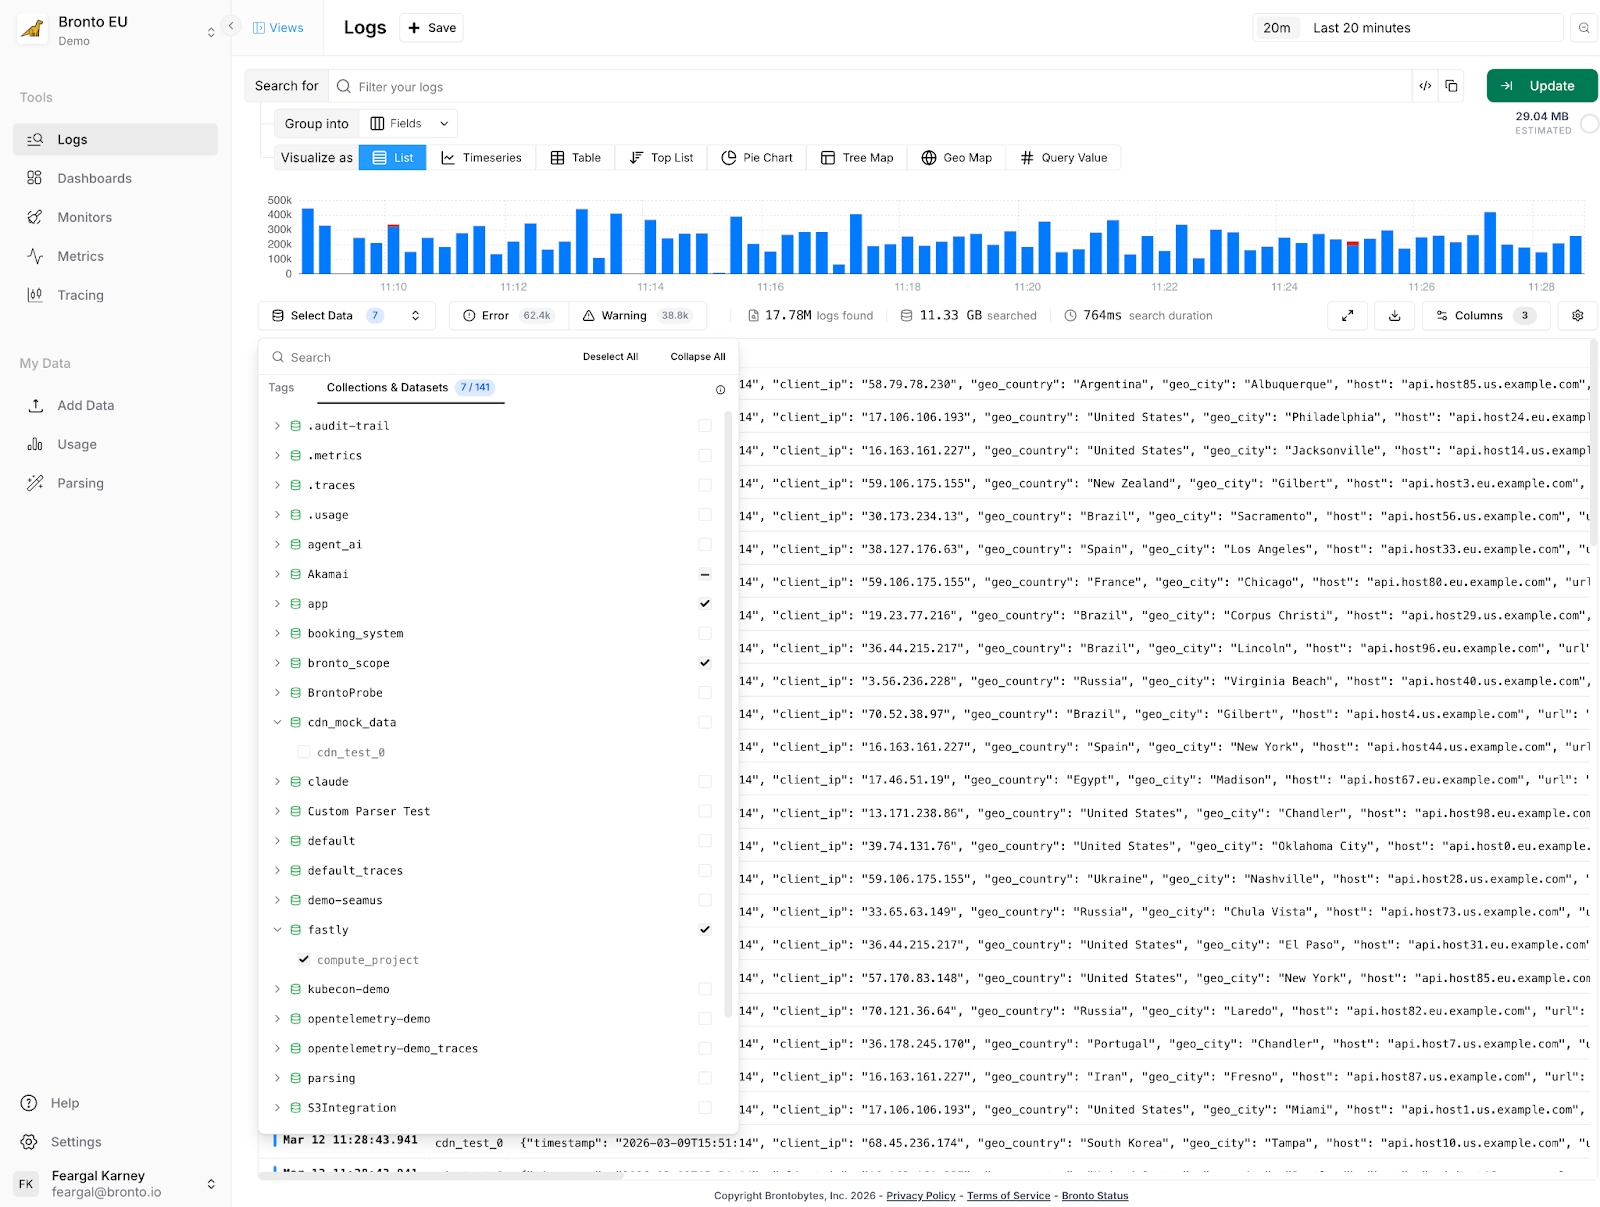
Bronto organizes logs into datasets and collections.
A dataset maps to a single log stream — think one service or one log file type. If you have ten servers running the same API service, their logs all land in the same dataset. You'd expect to find the same keys, the same structure, consistent behavior.
A collection groups related datasets together. The most natural use: separating environments. Your production api-server and your staging api-server are the same service running in different environments, but you almost never want to search their logs together. Staging may be full of errors by design. If you're chasing a production incident at 2am, you don't want staging noise muddying your results.
So in practice you might have a production collection containing datasets for api-server, payments, auth, and a staging collection containing the same services. When you search, you're scoped to the right collection by default — Bronto skips the rest entirely.
The problem with manual collection naming
This model works well for a lot of customers with a relatively static set of collections. In practice though the original implementation is not flexible enough for some customers
When onboarding new customers, we'd walk through questions like: Are you on AWS? Multiple regions? Using Kubernetes? Based on the answers, we'd suggest a collection naming scheme: prod-us-east-1-cluster1, something like that. It wasn't elegant. Teams had to make structural decisions before they'd sent a single log event — and whatever they chose was hard to change later.
More concretely: if you wanted a monitor that alerted on errors across all your Lambda functions, you'd select each dataset individually. Ship a new Lambda function next month, and you'd need to find every monitor, dashboard, and alert that should include it and update them manually. That's a maintenance burden that compounds as infrastructure grows.
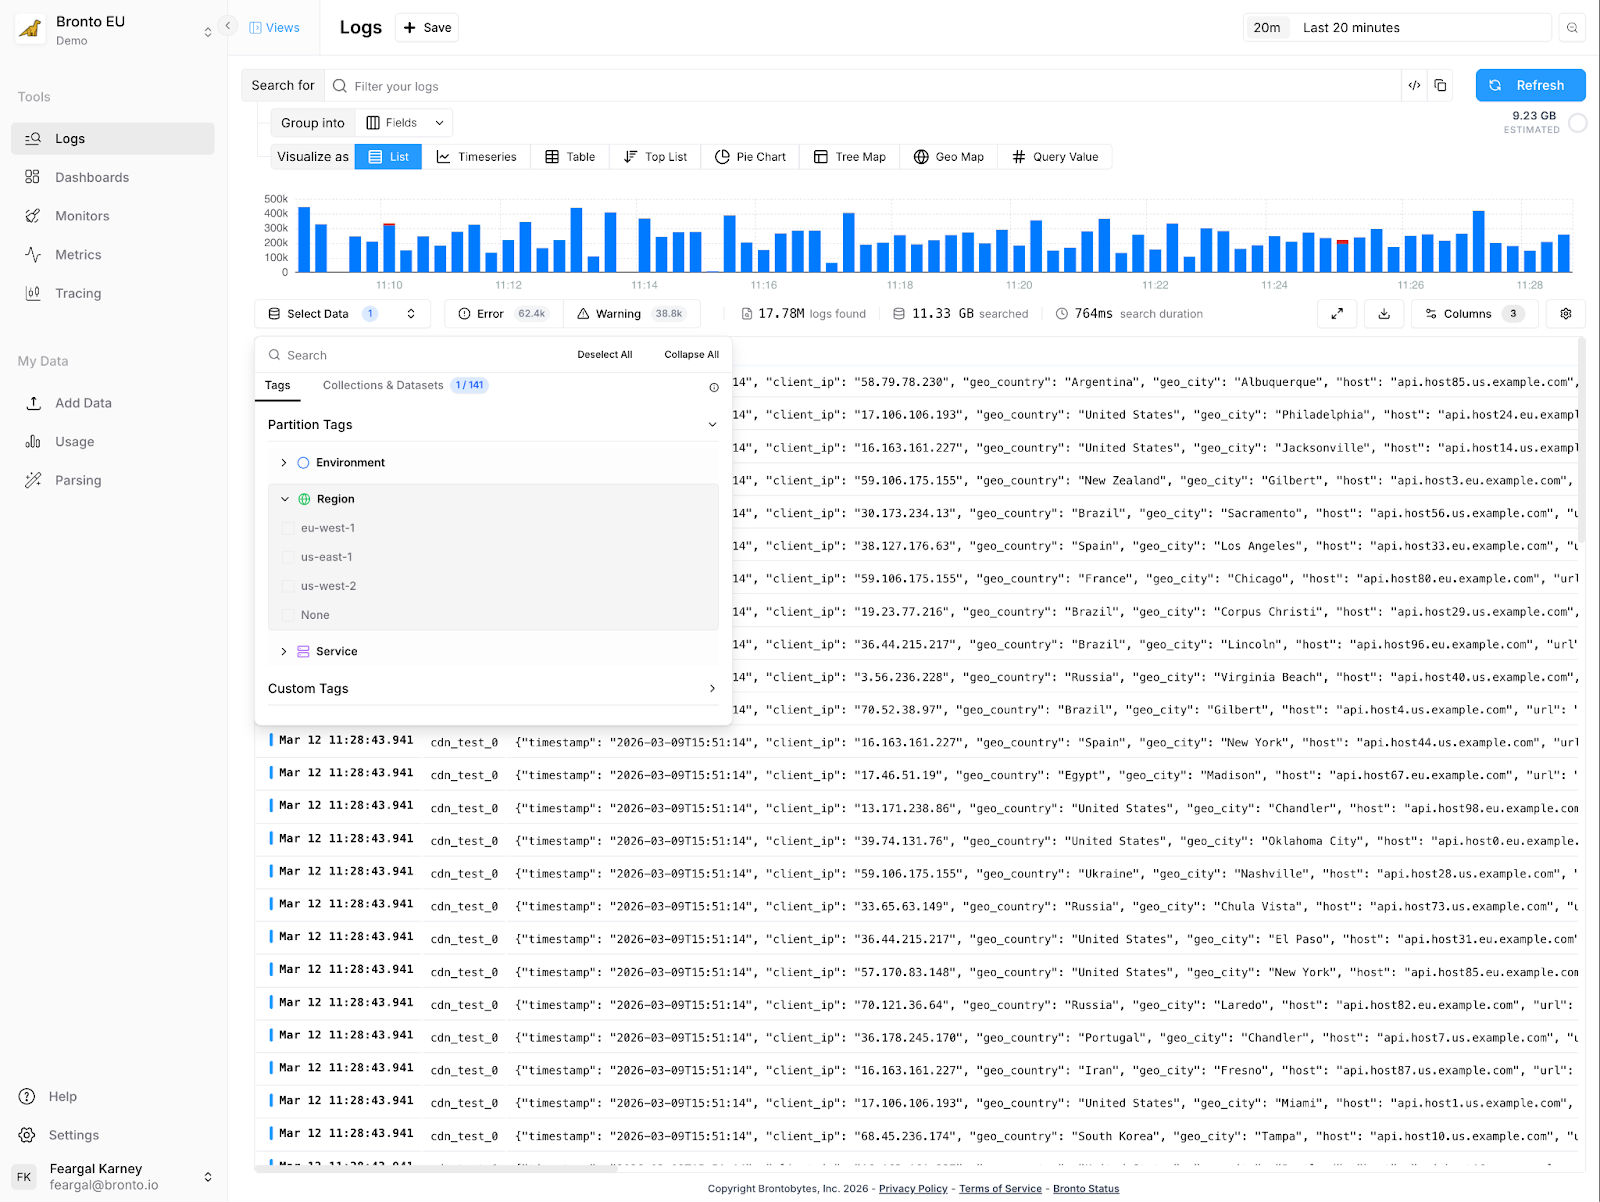
Partition Tags: describe your environment, not your naming scheme
Instead of crafting collection names yourself, you configure your collection agent, e.g. OpenTelemetry, FluentBit etc. with a simple set of key-value tags describing where it's running:
x-bronto-tags:
"environment=production,region=us-east-1,cluster=cluster1"
Bronto uses those tags to automatically derive the collection. The collection production-us-east-1-cluster1 gets created behind the scenes — you never have to name it.
More importantly, those tags become primary search filters. When you open search, you see clickable partition selectors: filter to production, narrow to us-east-1, focus on cluster1. Behind the scenes, Bronto is using those selections to determine which data to scan. If you're searching production/us-east-1, we don't touch your staging data or your EU region. Fewer bytes read, faster results, lower costs and more flexibility in how you arrange your data and more flexibility in how you arrange your data..
The monitor problem referred to above is also solved. Instead of selecting specific datasets, you tag your datasets with lambda-function=true (or whatever makes sense) and create a monitor targeting that tag. Ship a new Lambda function? Tag it. It automatically falls under all your existing monitors and dashboards. No manual updates.
What this means for low-cardinality vs. high-cardinality fields
It's worth being clear about the distinction between partition tags and log attributes, because this is where we differ from label-heavy systems.
Partition tags are low-cardinality values: environment, region, cluster, service tier. You want a small, stable set of these — fields where the number of distinct values is measured in tens, not thousands. They control how data is physically organized.
Log attributes — trace IDs, user IDs, request paths, error codes — live inside your log events. Bronto indexes these separately using bloom filters and summary indexes, so you can search on high-cardinality fields without them affecting partitioning at all.
This separation is what lets us avoid the cardinality trap suffered by some other vendors, while still giving you full-fidelity search across every field in your logs. You don't have to choose between organization and flexibility.
An approach that fits modern configuration management
If you are already using modern infrastructure as code tools e.g. Terraform, CloudFormation or Ansible, adding tags is as easy as setting Bronto as the destination for your logs. You need to think briefly about which tags describe your infrastructure. For most teams this is less than five minutes of work — environment, region, cluster is a sensible default and we'll suggest it. In fact, we use partition tags for our own logs using environment (production, staging) and region partition tags.
What you get in return: every search scans less data, therefore improving overall query performance, and your dashboards and monitors keep working correctly as your infrastructure evolves. Add a new region? Add a new cluster? Configure the agent with the right tags and it slots into your existing observability setup automatically.
Partition Tags are available now. Enable them in Settings → Partition Tags. We'll suggest defaults based on common infrastructure patterns — you can accept them or define your own. Learn more here.