
Vercel is one of the breakout stories of the AI boom. From being a scrappy deployment tool on launch ten years ago, it is now the platform of choice for over 6 million developers, with 100,000 new signups every month. No surprise that it is now touching on Decacorn status at a $9.3B valuation.
That kind of adoption doesn't happen by accident – it's the result of a genuinely exceptional developer experience. Instant deployments, per-branch preview environments, a global CDN that just works, and a framework-defined model that deploys your app without you writing a line of config.
And the scope keeps widening. What started as the home for Next.js now covers most of the modern frontend ecosystem, zero-config backends for popular Python and TypeScript frameworks, and a full AI Cloud on top. If you’re building a web or agentic app Vercel is the obvious home for it.
Vercel's built-in observability is purpose-built for the deployment workflow – real-time, per-request, fast. Observability Plus includes up to 30 days of retention (with a 14-day query window) and richer performance breakdowns. What it doesn’t cover is everything else logs get pulled into: investigating an incident that started three releases ago, running analytical queries over months of traffic, or letting an AI agent dig through raw events on your behalf.
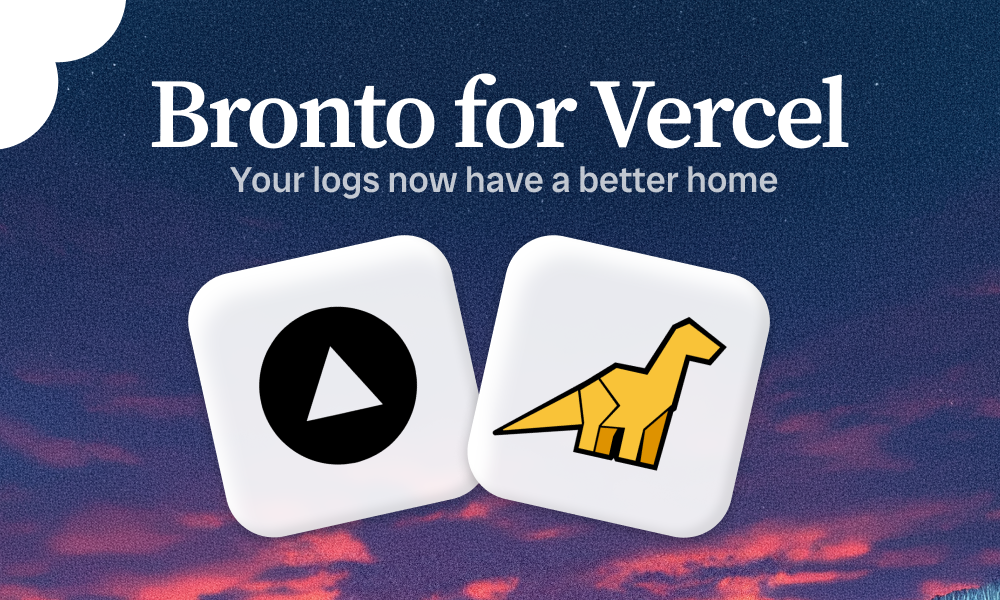
That’s where Bronto comes in. Bronto now integrates directly with Vercel. Once your drain is configured, your logs land alongside every other source in your stack, with:
- 12 months of hot retention, no sampling. Every log fully indexed, queryable the same way at day one or day 300.
- Sub-second search over terabytes. The difference between running the query and deciding it’s not worth the wait.
- Dashboards built for scale. Long-range comparisons, percentile breakdowns, and an AI widget creator that builds charts from a plain-English prompt.
- AI investigation built in. When a monitor fires, Bronto can investigate autonomously and deliver a root-cause report as a follow-up. BrontoScope does the same for any error event, on demand.
- A richer exploration UI. Simple and SQL search modes, auto-parsing, automatic error detection, and live tail.
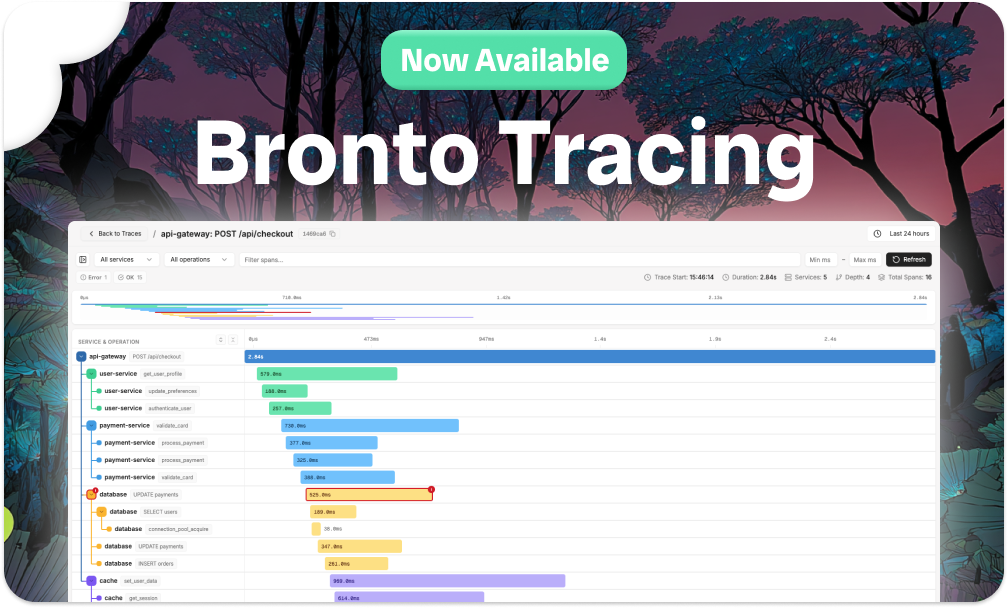
- Native tracing at scale. Ingest traces from Vercel and other external sources alongside your logs, then pivot between them in a click.

Setting it up
Vercel exposes log data through log drains – a webhook-style forward of runtime logs, build logs, edge function output, and more to a custom endpoint. You can also drain web analytics data (page views, custom events, real user performance metrics) using the same setup. You can get full setup instructions on our Vercel docs page.
(Note: Vercel log drains require a Pro or Enterprise plan.)
What you can do with Bronto
Once your Vercel logs are in Bronto, they behave like any other log source.
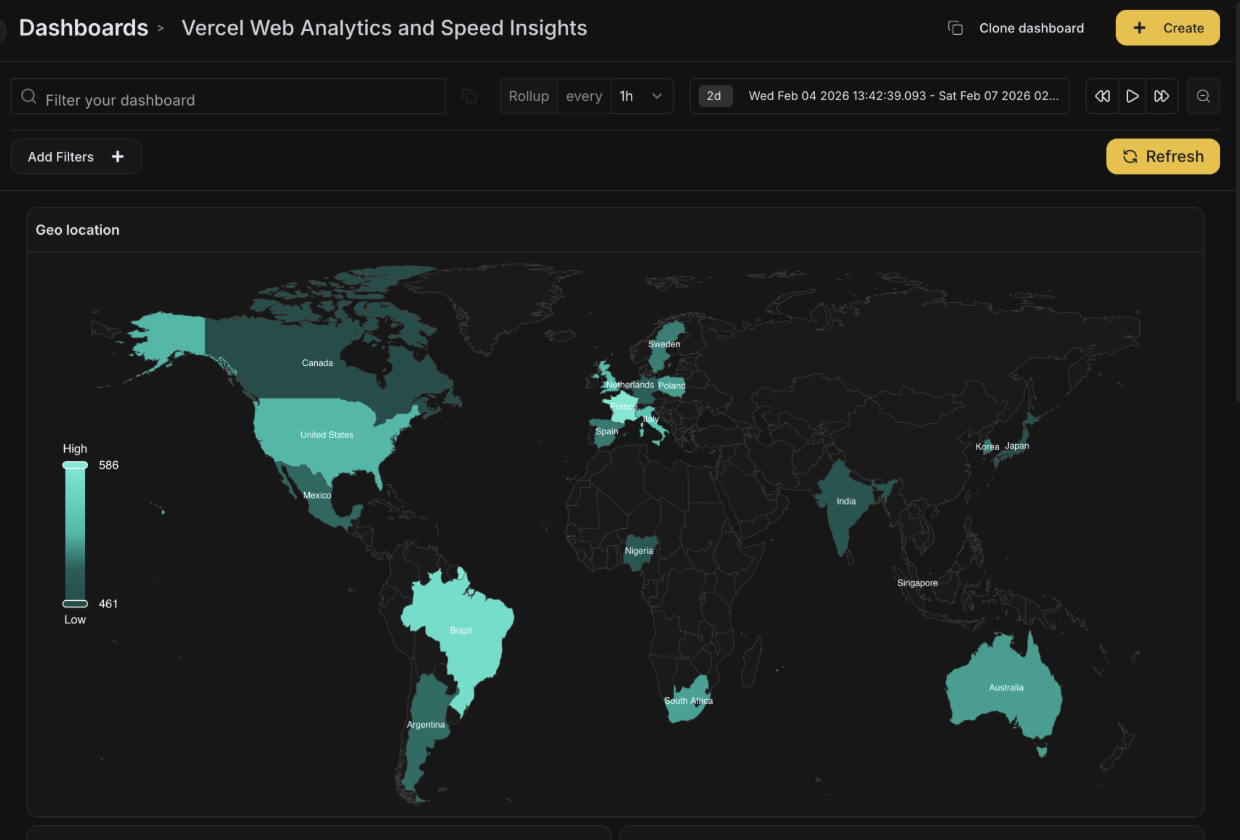
Long-term performance tracking. With web analytics data flowing in alongside your logs, you can track Core Web Vitals — TTFB, FCP, LCP, INP, CLS — over months rather than days. That's the difference between reacting to a spike and actually understanding whether your performance is trending in the right direction across releases.

Multi-deployment debugging. Some bugs don't show up in the last 30 minutes – they emerge gradually across a series of deployments. With a year of log history, you can search across deployment boundaries, correlate error rate changes with specific releases, and build a clearer picture of how your system has evolved over time.
Headless access via MCP. Connect Claude (or any MCP-compatible agent) to your Bronto data and run natural-language analysis directly against your Vercel logs. Ciarán’s post highlights how Bronto’s hosted MCP server streamlines common DevOps tasks like investigating unusual traffic.
Custom instrumentation. You can also generate your own logs from within your Vercel application and ship them to Bronto alongside the platform logs – giving you far more flexibility than Vercel's built-in observability. As an example: if you're running an AI feature, you can track token usage, model costs, and recent prompts directly in a Bronto dashboard.

Build the interface you actually want
When your data is in Bronto, you're not locked into a single UI. The Bronto REST API exposes everything our own interface is built on, which means you can build custom views on top of your Vercel data using whatever tool fits your workflow.
It’s the same idea as with our Lovable integration: remix the baseline project, point it at your Vercel datasets, and prompt your way to a dashboard that's specific to your application. Want a scheduled weekly report of your Core Web Vitals? A view that correlates deployment events with error rate changes? Build it. The API is there.
A note on cost
Vercel charges $0.50/GB for data leaving through log drains – a platform cost regardless of where the logs end up. The good news: Bronto is the most cost-effective logging platform on the market, priced as low as $0.10/GB at scale, which is 50–90% cheaper than incumbent solutions. So even with Vercel's egress factored in, you're still coming out well ahead of what you'd pay to keep the same data in a traditional log platform. And because Bronto doesn't sample, index-select, or shunt old data into cold tiers, the cost you see is the cost of keeping everything hot, searchable, and retained for a year.
Get started
Connect your Vercel logs to Bronto by following the steps in our docs.