
When your tracing vendor samples 90% of spans to keep costs manageable, 9 out of 10 requests become untraceable. When retention expires after 15 days, last month's incident is gone.
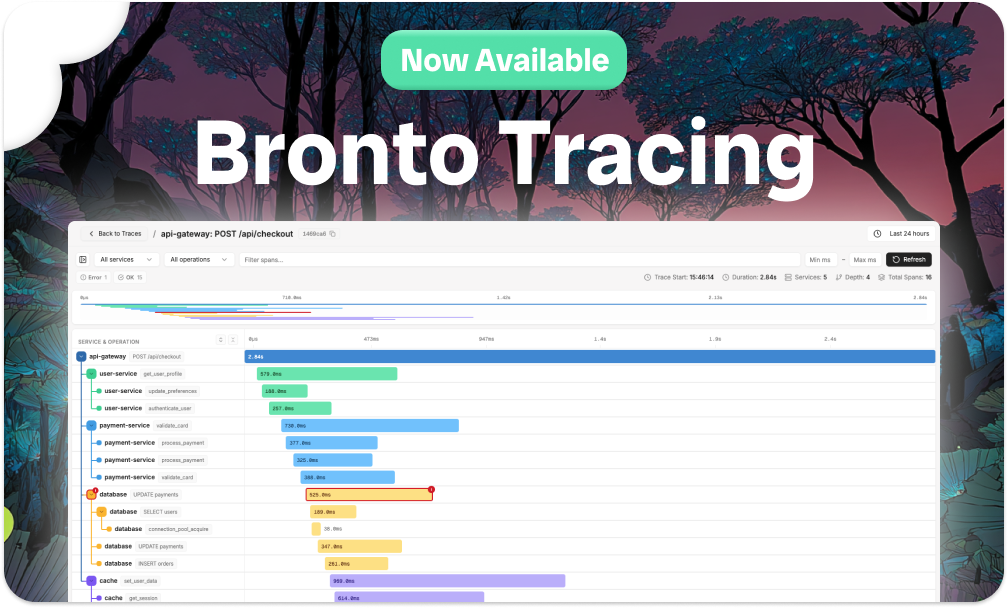
Bronto Tracing is now generally available. It runs on the same architecture that makes Bronto logs cost-efficient and fast at scale: every span you send is stored, in full, without sampling. Default retention is 12 months on every plan, at no extra cost. If you need a trace from three months ago for a postmortem or a compliance review, it's there.
The same economics apply to traces: you pay for what you ingest and retention doesn't compound the bill. That means you can instrument every service without scoping down coverage to manage bill risk. No sampling rules to write or maintain, and you don't find out which traces you're missing one incident at a time.
Bronto is OTel-native with no proprietary agents. Logs and traces live in one platform, one investigation workflow. If you're already forwarding spans to Bronto, this is live in your account now.
From logs to traces and back again
If you've set up logs and traces using our OTel SDK guides,cross-signal correlation works automatically. No extra configuration needed.
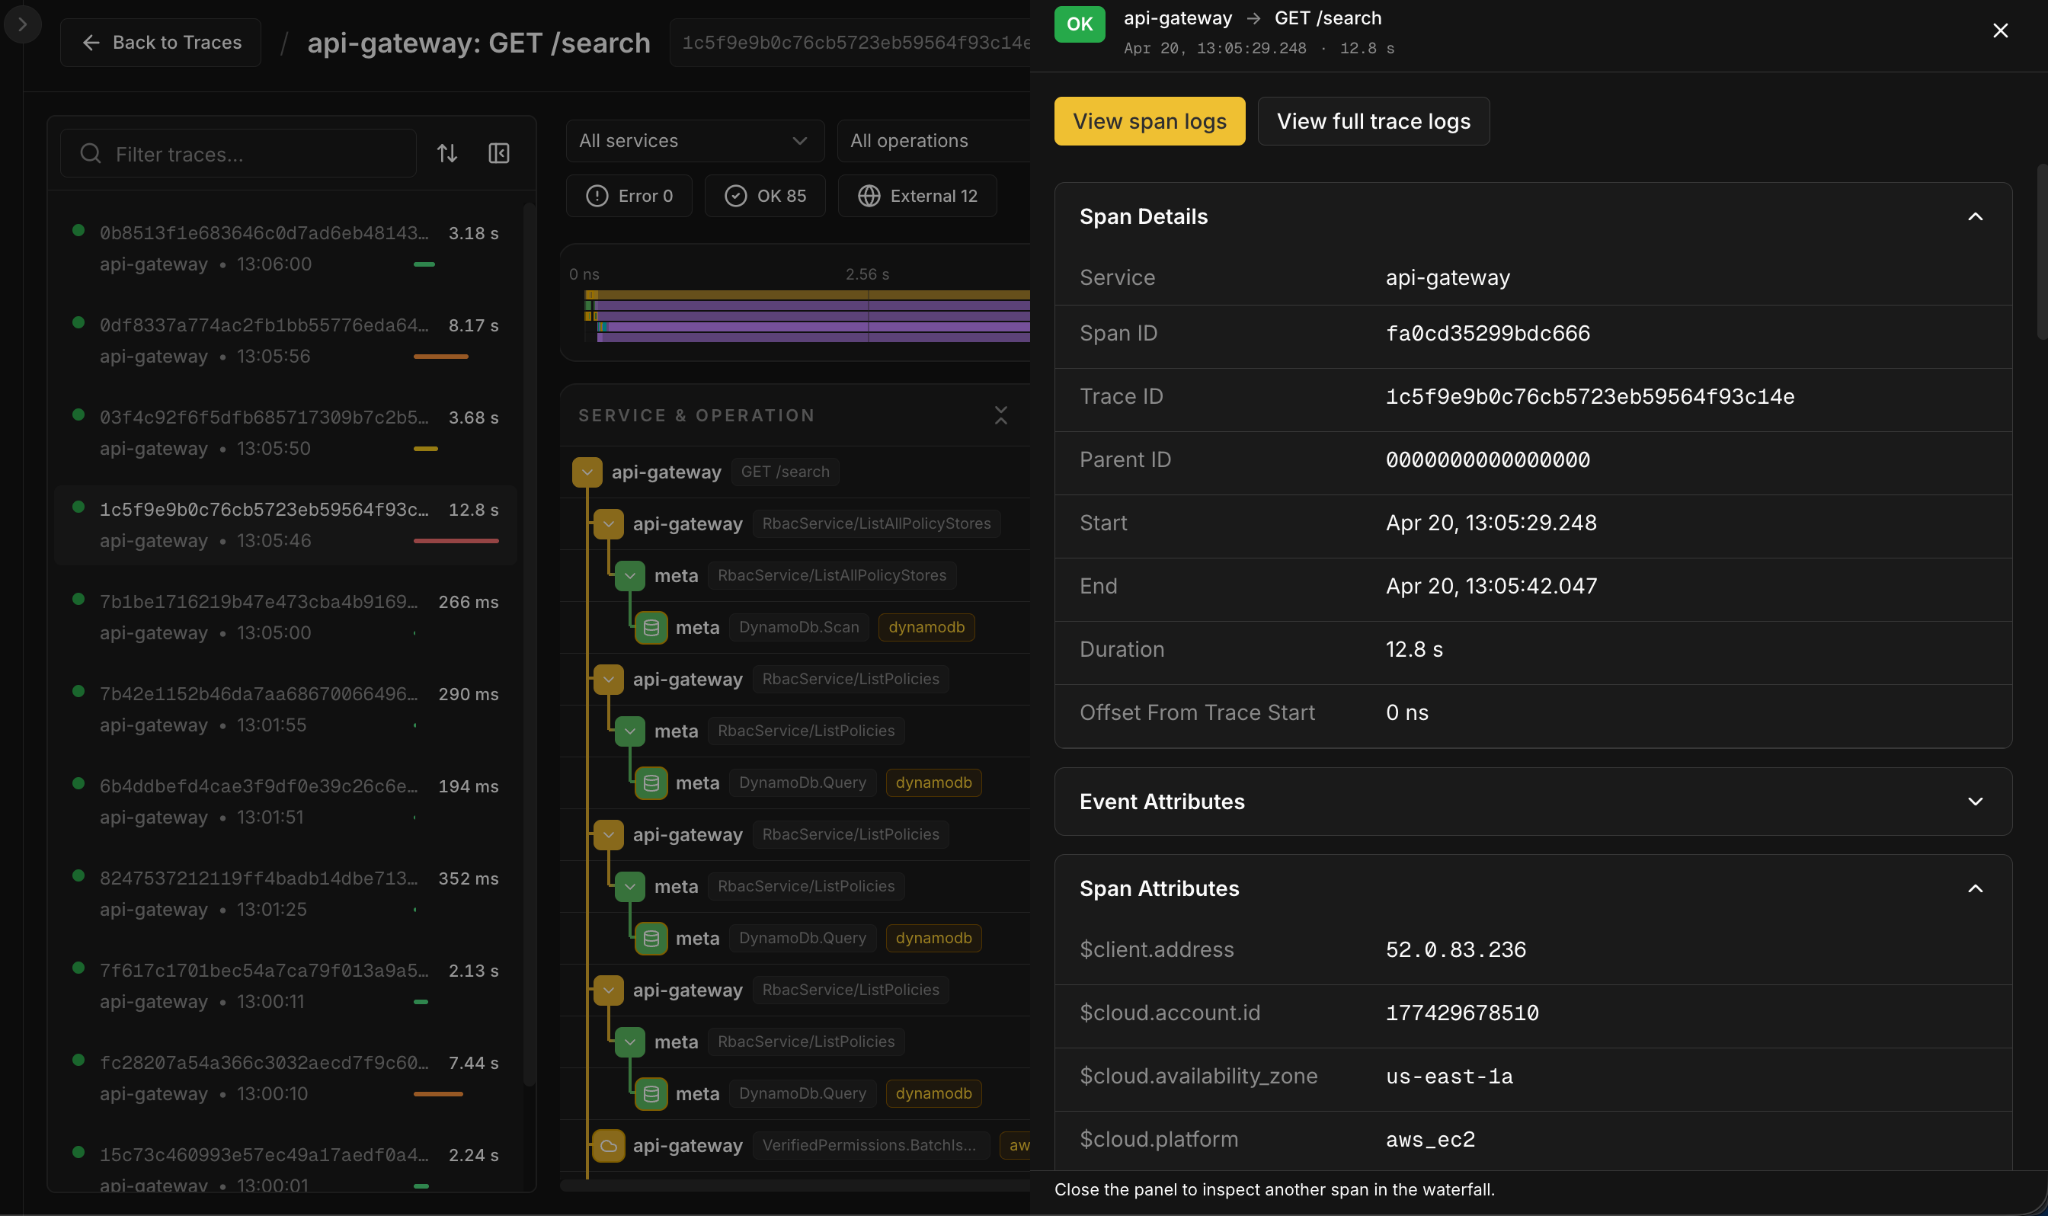
During an investigation, the moment you find a suspicious span is the moment you need its logs. Click the span. View span logs shows you what that one span was doing. View full trace logs shows you everything the request touched. One click either way.
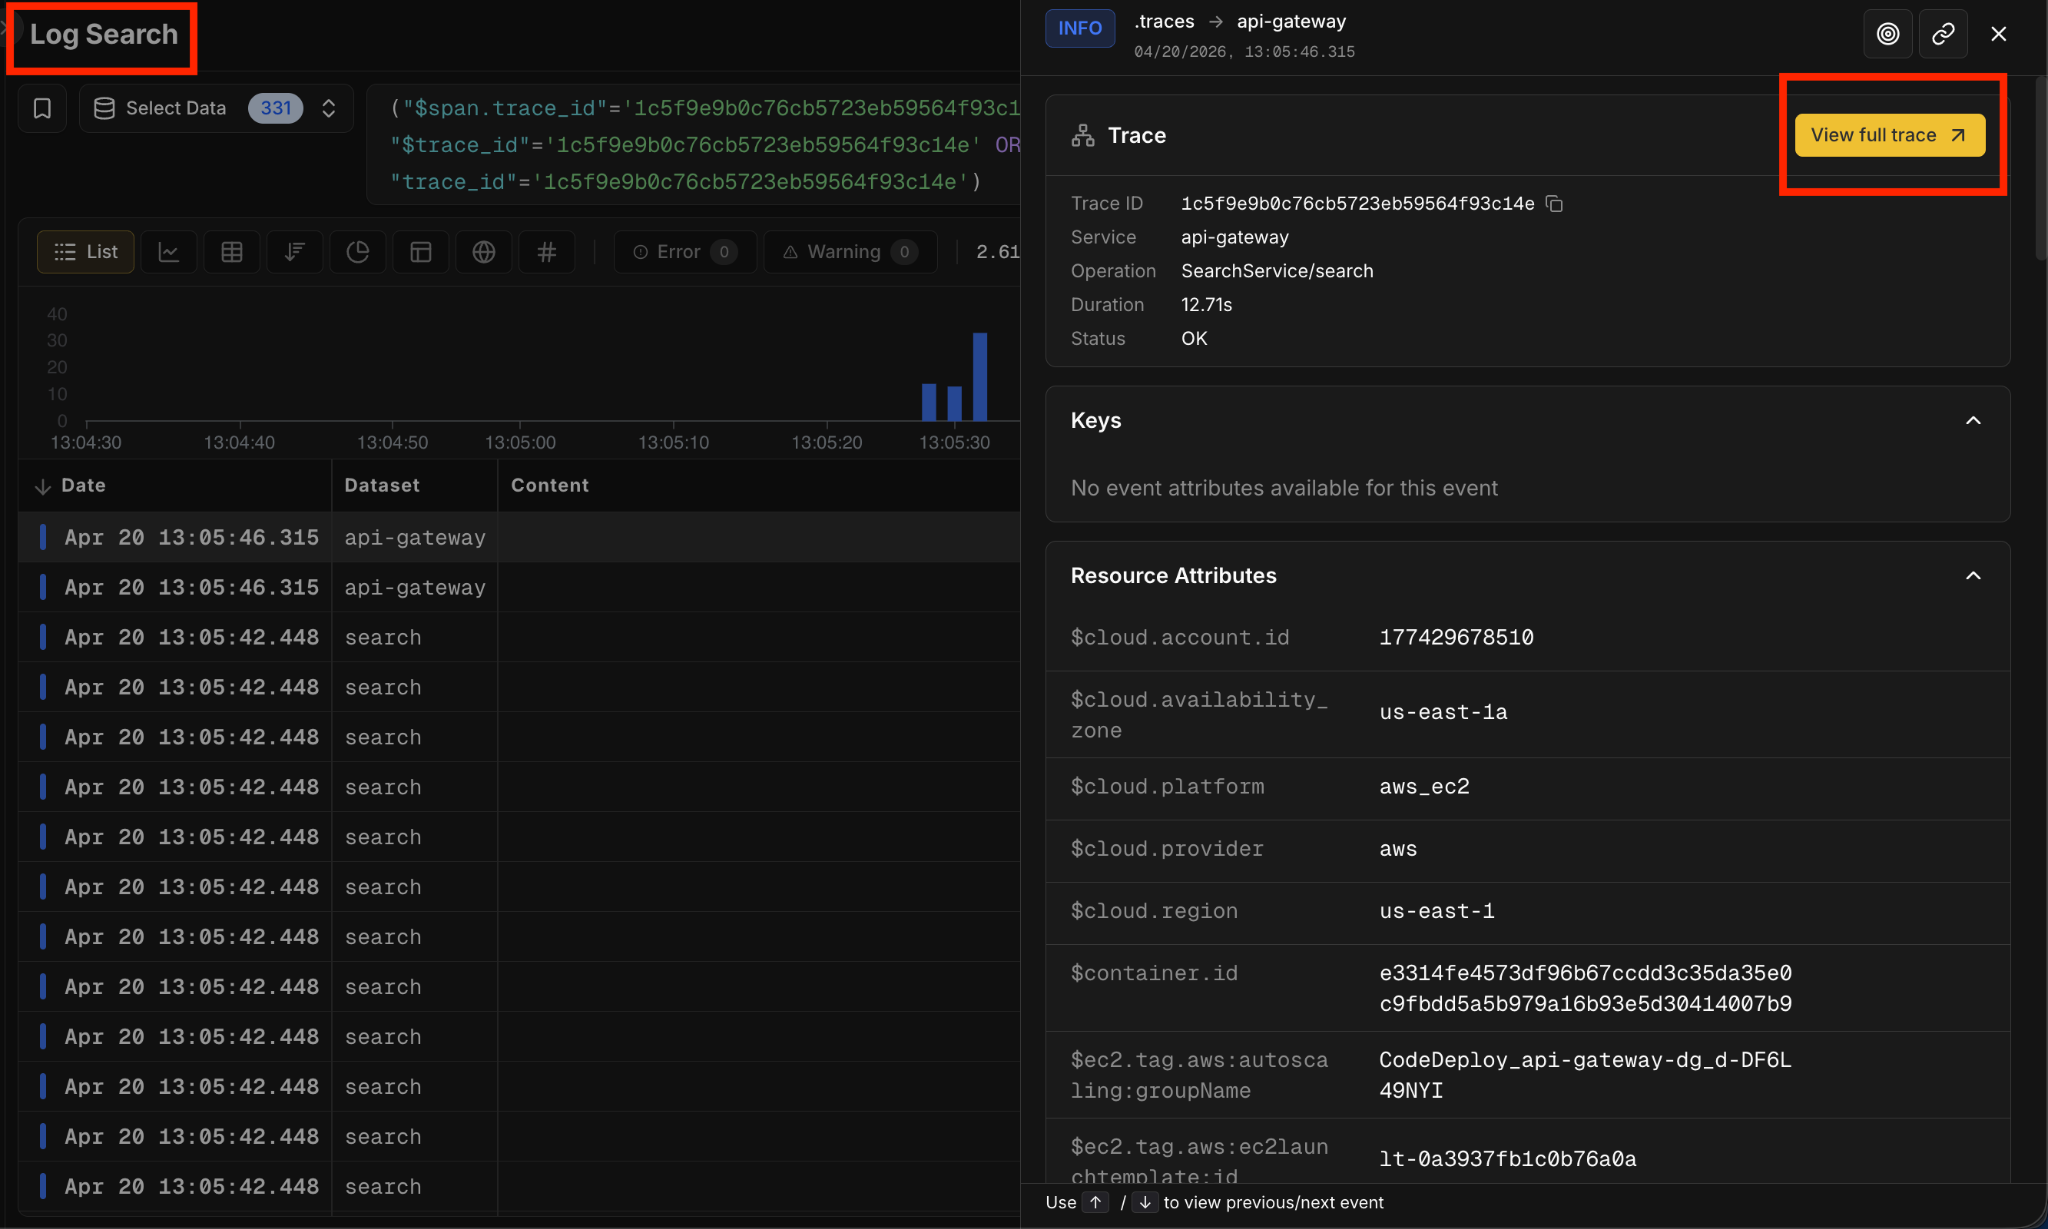
It works the other way too. Open a log event in Log Search, and if it has trace context, you'll see a Trace card with a View full trace button. Click it, and you're in the waterfall.
Two entry points, same destination: the trace waterfall.
From alert to root cause to logs
What follows is a real investigation on our own infrastructure, from the alert to the bottleneck to the logs that explain it.
Suppose you're on call; you’re paged after an alert fires on elevated p99 latency for your api-gateway service.
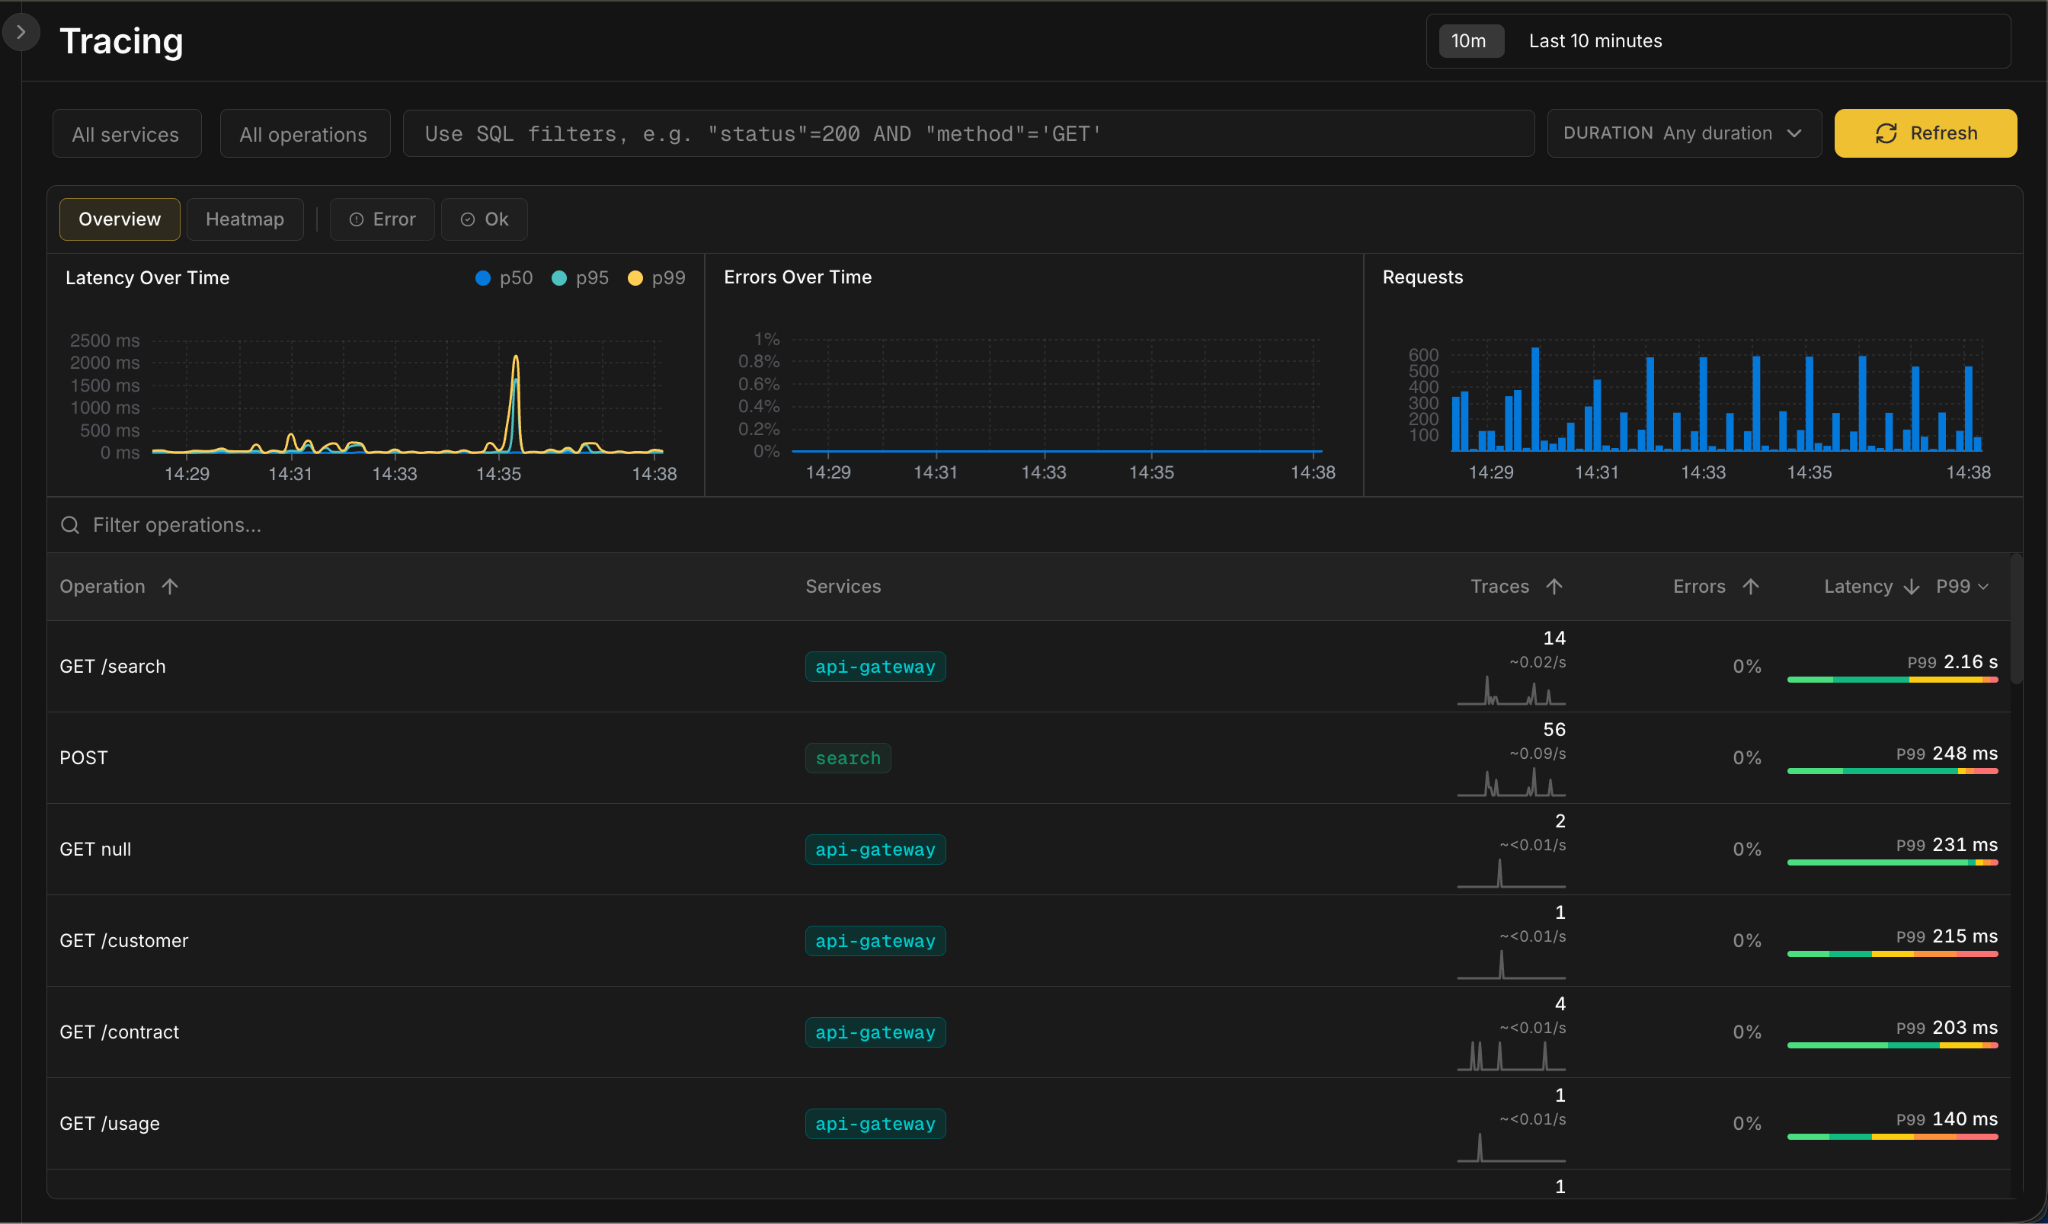
Open Bronto Tracing. Three cards at the top track the golden signals that matter when you're paged: latency (p50, p95, p99), errors, and traffic. The Latency card shows a clear p99 spike around 14:35.
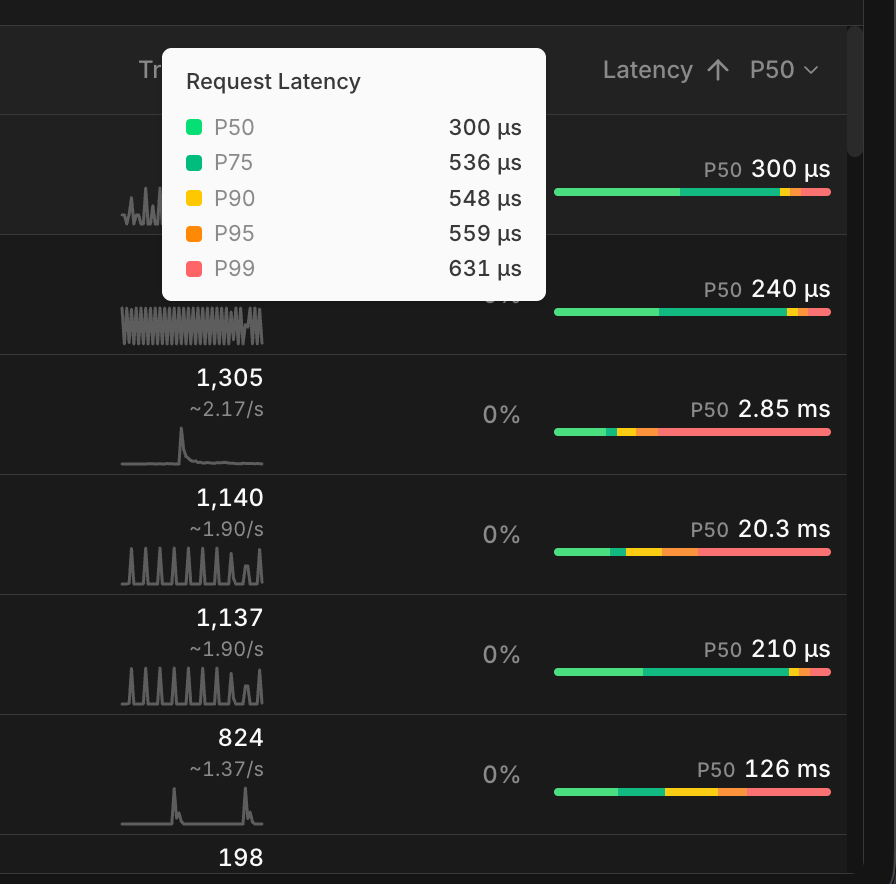
Below, every operation is broken out by service: request rate, error rate, and a latency bar you can hover for the full p50-to-p99 spread. Filter by service, operation, duration, or write SQL for anything more specific. Sort by p99 and GET /search jumps to the top at 2.16 seconds.
Click the spike in the Latency chart. View associated traces drops you into the trace list filtered to that moment, sorted by duration. Open the slowest one: 2.16 seconds, 86 spans across four services.
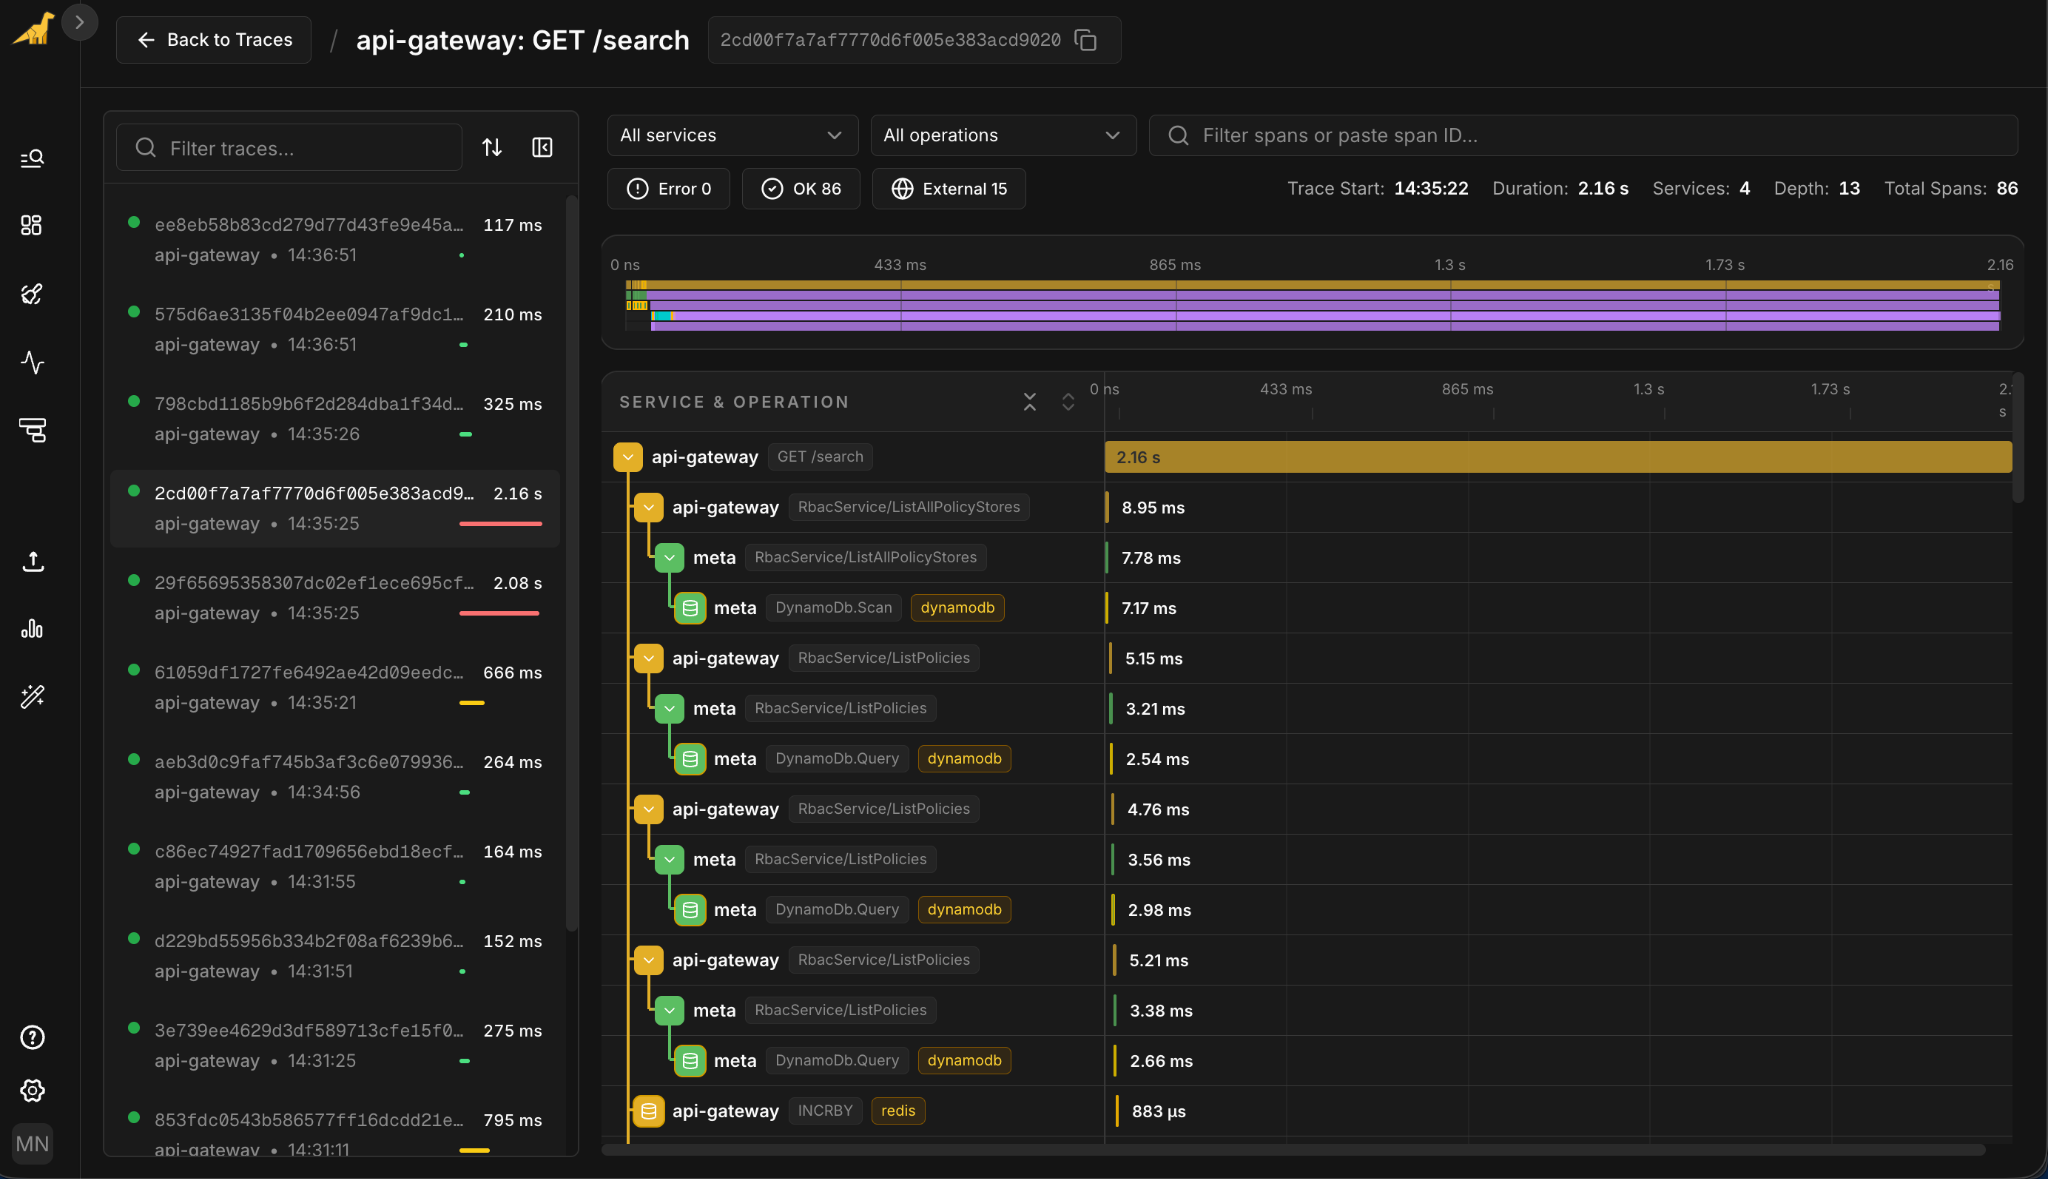
The top of the waterfall looks healthy. The gateway calls into RBAC services. Those services hit DynamoDB for policy lookups. Verified Permissions checks the request. Each of those steps runs in single-digit milliseconds. The auth path isn't your problem.
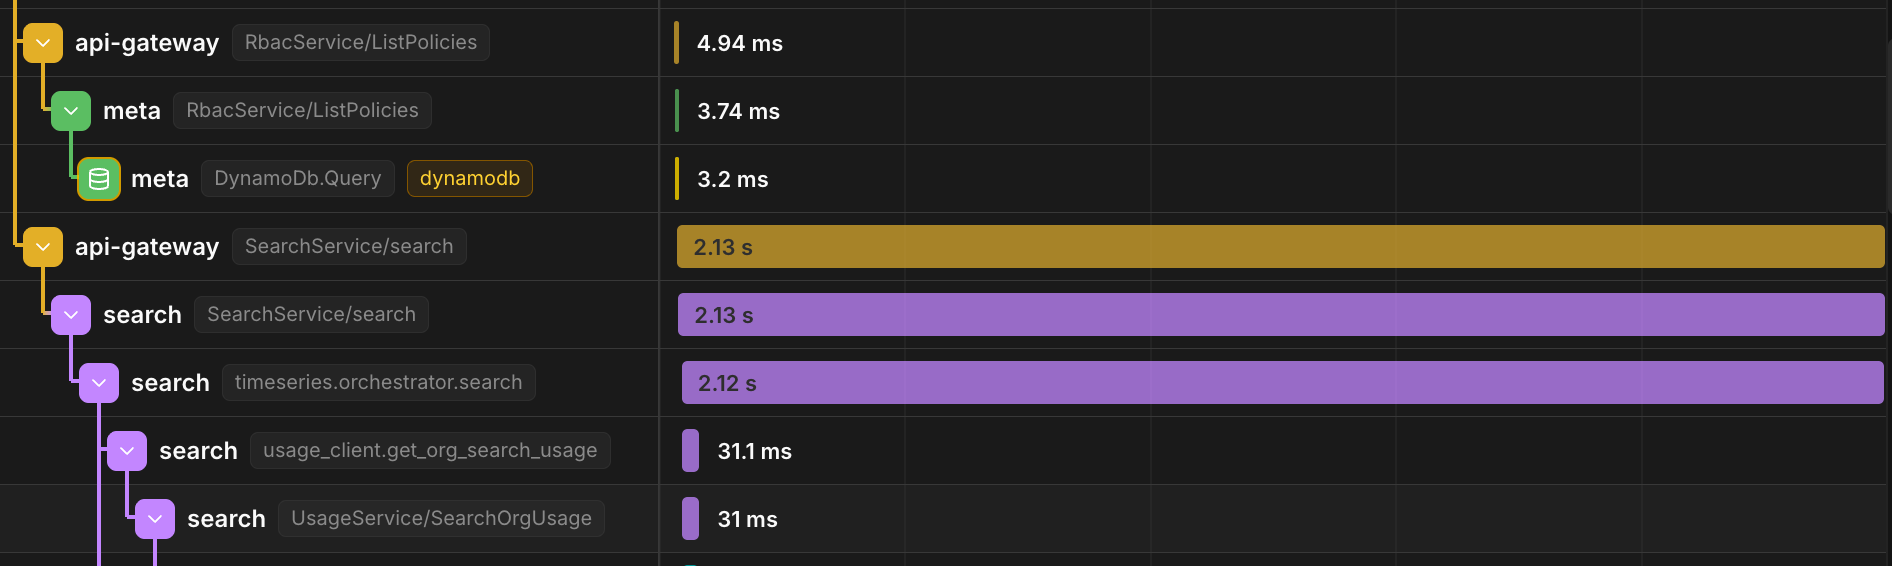
SearchService/search is taking 2.13 seconds, and almost all of it, 2.12 seconds, sits inside a single child span: timeseries.orchestrator.search. The 31ms of usage tracking below it and the single-digit milliseconds on the RBAC and DynamoDB calls above barely register.
With every span stored and nothing sampled out the bottleneck is obvious.
From the slow span's detail panel, click View full trace logs. The related log events open in Log Search, filtered to this trace ID, across api-gateway, search, and meta.
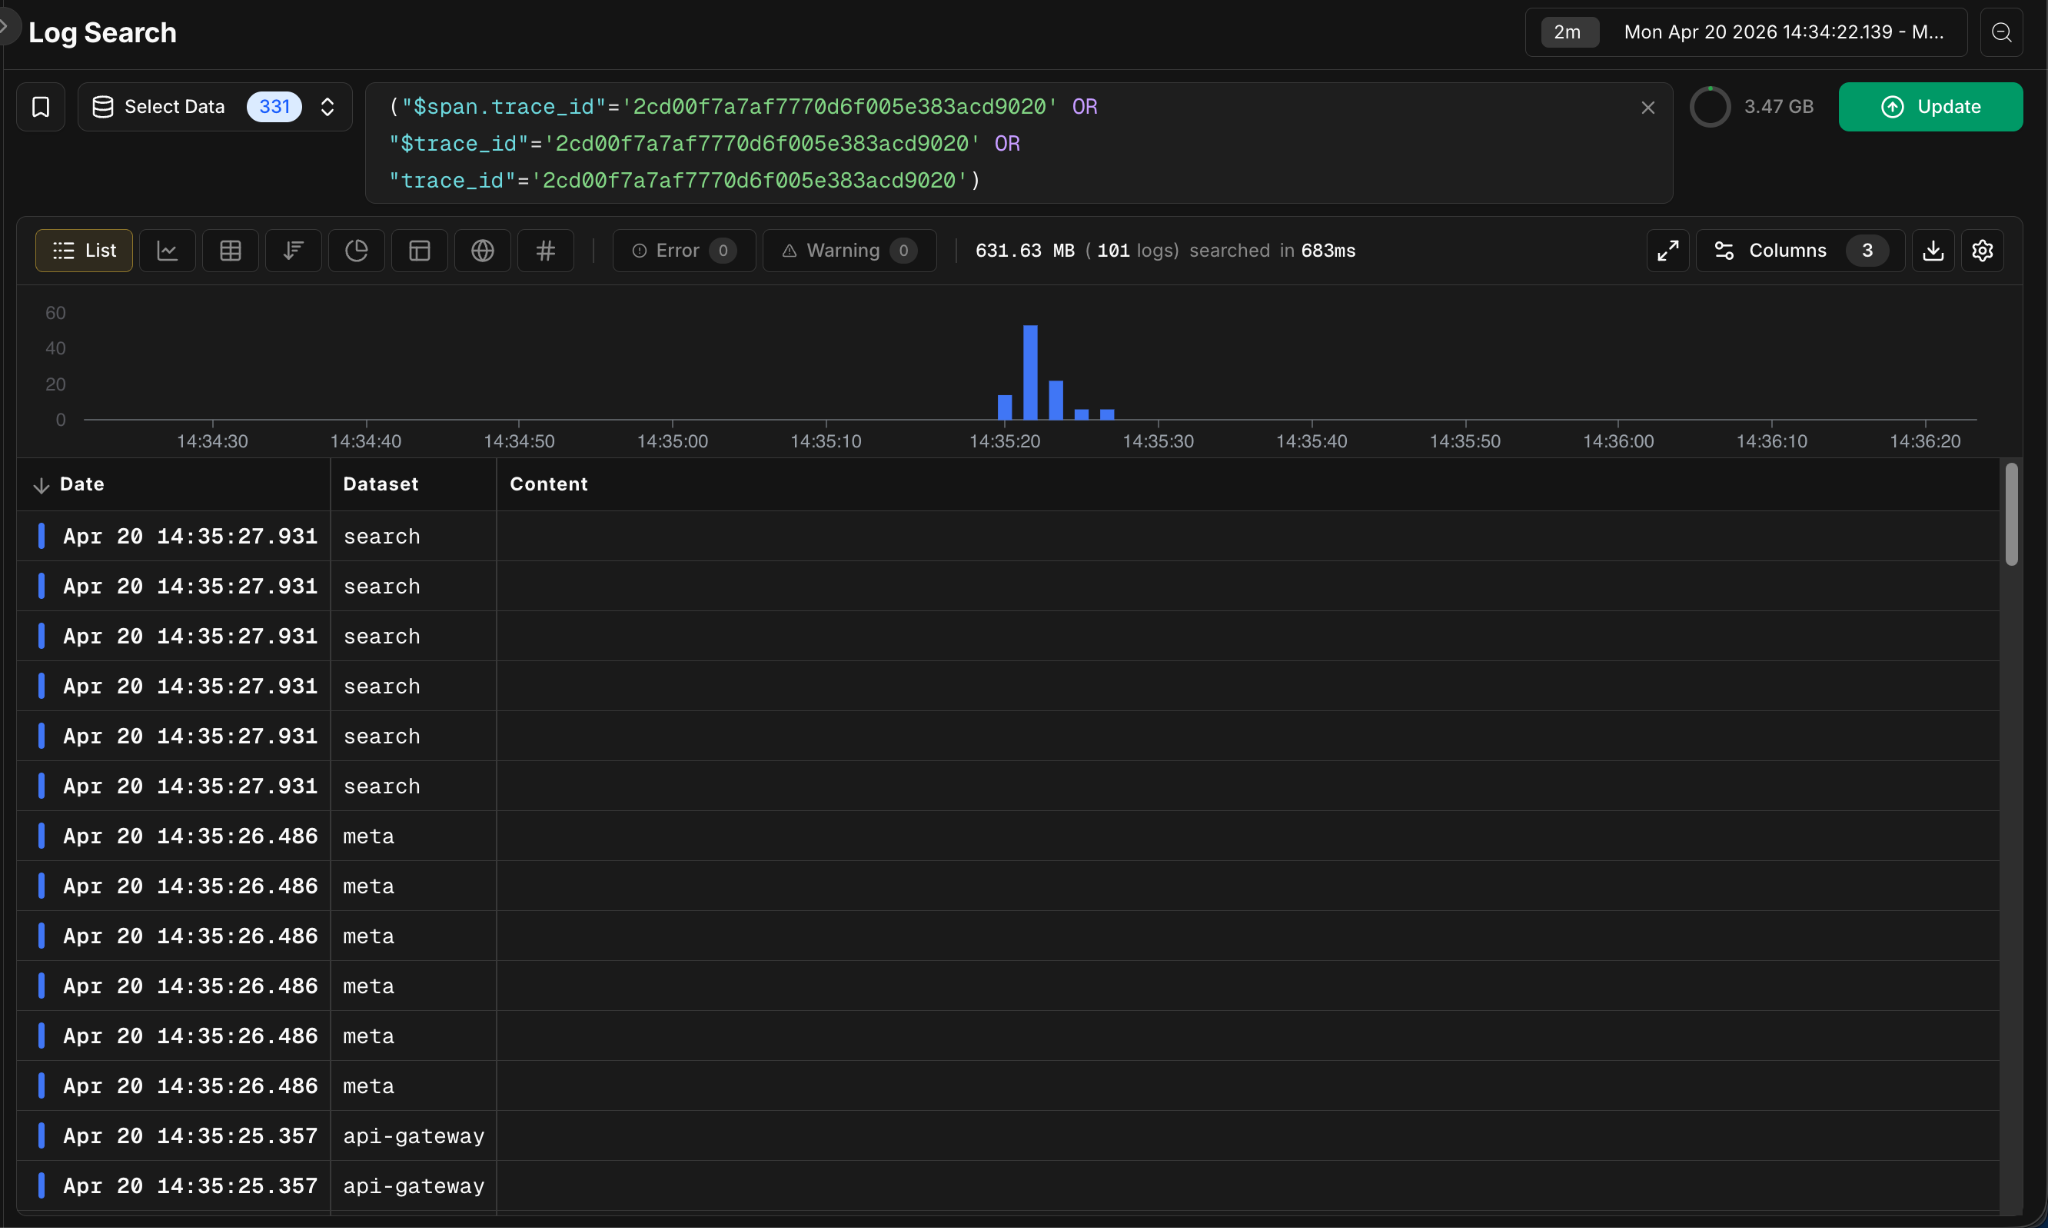
From alert to root cause to logs. No queries to write.
Get started
Tracing is live now for all Bronto accounts. If you're already forwarding OpenTelemetry trace data to Bronto, the overview and the bidirectional correlation are available immediately in the Tracing section of your account.
If you're new to Bronto, you can sign up for a trial today to get started.
For instrumentation, dashboard filters, and the full capability reference, see the Tracing documentation. We ship instrumentation guides for twelve languages, each covering logs and traces through a single OTel SDK setup: .NET, C++, Erlang/Elixir, Go, Java, Kotlin, Node.js, PHP, Python, Ruby, Rust, and Swift.