.png)
As the Customer Success lead in Bronto I need fast, reliable insights into customer health and product usage but I don’t have time to constantly update indexes, schemas, or individual widgets just to answer new questions. I need a way to spot patterns, explore trends, and get answers in real time without any manual overhead. That’s why Bronto's dashboards are so critical. They let me quickly surface the insights my leadership, sales teams, and customers need, when they need them.
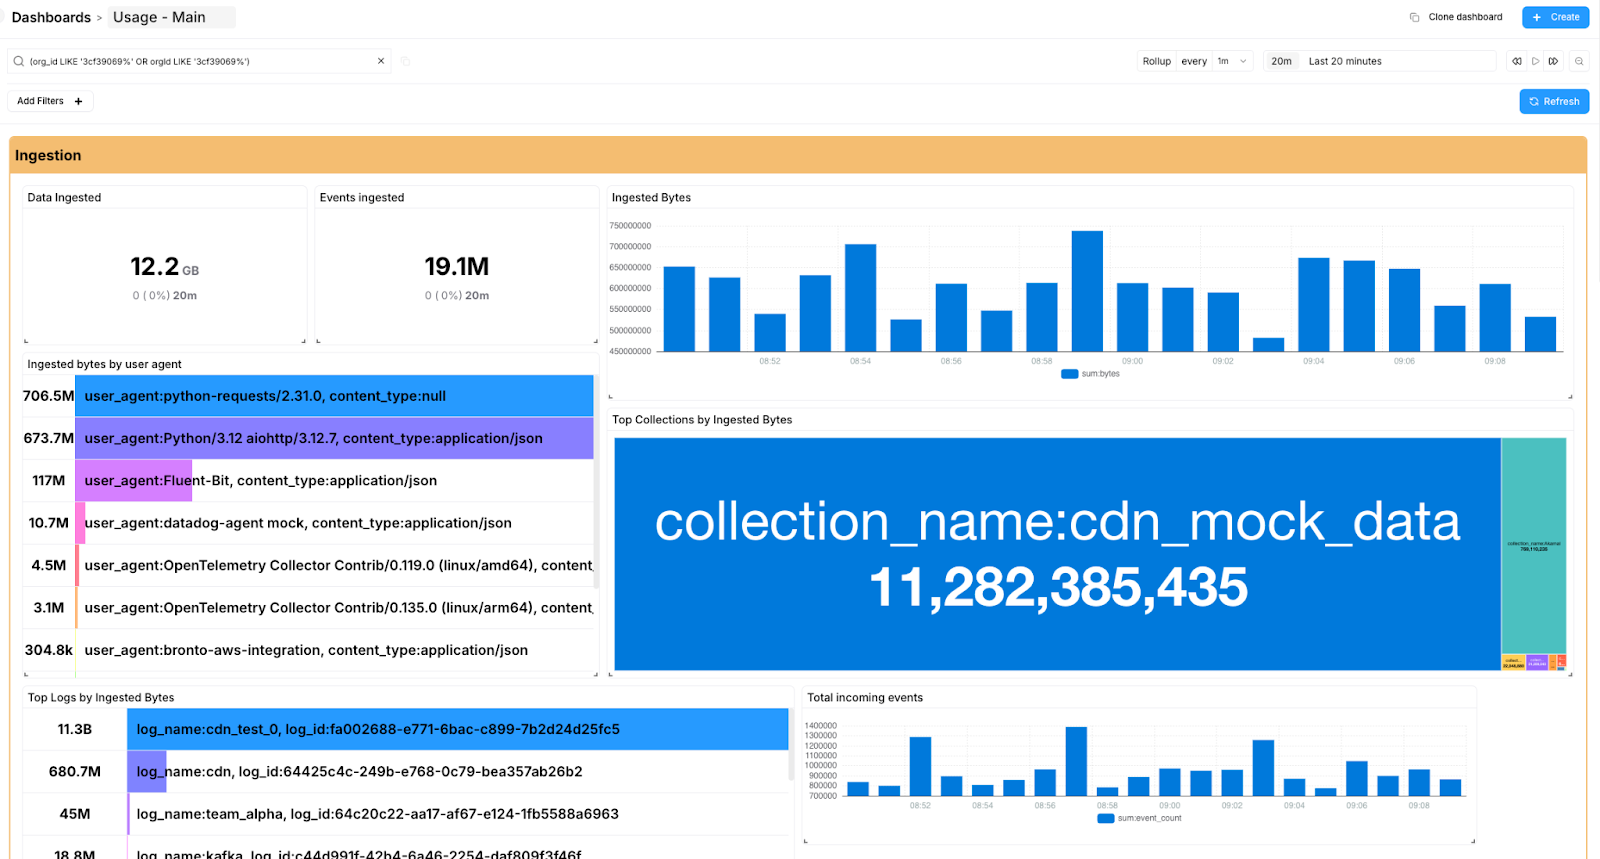
We recently added a new query filtering feature to our dashboards that allows me to use our SQL query language to look for any patterns in the widgets in the dashboard and update all those widgets at lightning speed.
This blog will explain the power of Bronto’s dashboards, explain the new query filtering feature and show an example of how I use it.
What can our dashboards provide?
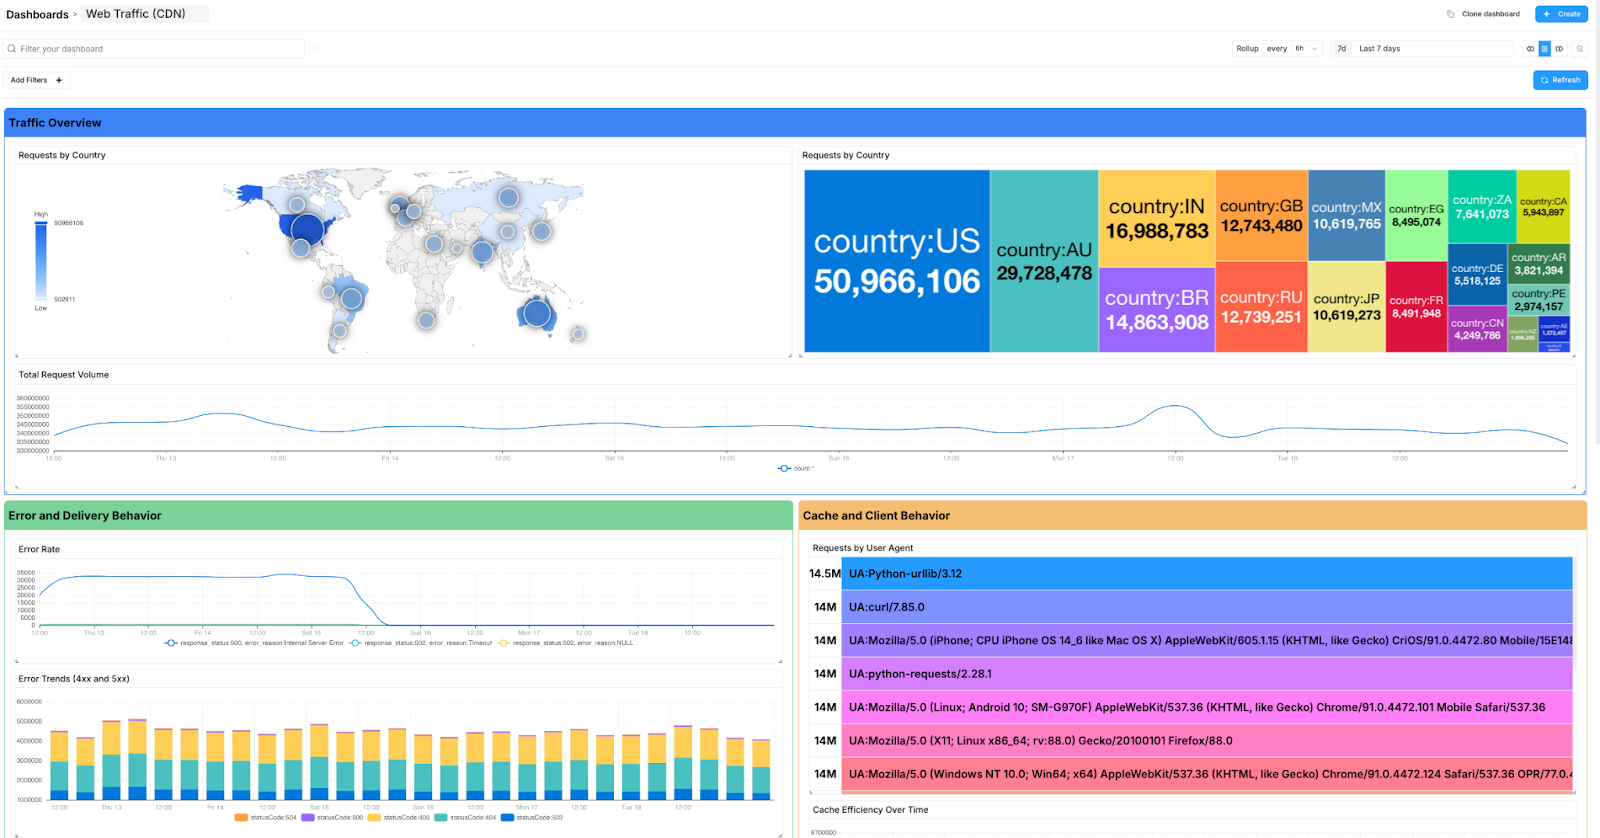
As an observability company, powerful, easy to use and responsive dashboards are non-negotiable. This is what you can do with Bronto’s dashboards.:
- Rich visualisation options:
- Time-series charts for trends over time
- Geomaps for geo-distributed traffic and activity
- Numeric value widgets (with units like bytes & time)
- Top lists and treemaps for quick breakdowns
- Log event lists for drilling into raw data
- AI widget builder:
- Use natural language to describe what you want in your widget. We then build prompts using an LLM and create the widget requested, without you having to know the query language or even which datasets to select. See previous post here on our widget creator.
- Full screen widget mode:
- Allows you to compare different timeframes for the same query, e.g. compared to previous day, week, month.
- Easy to use filtering:
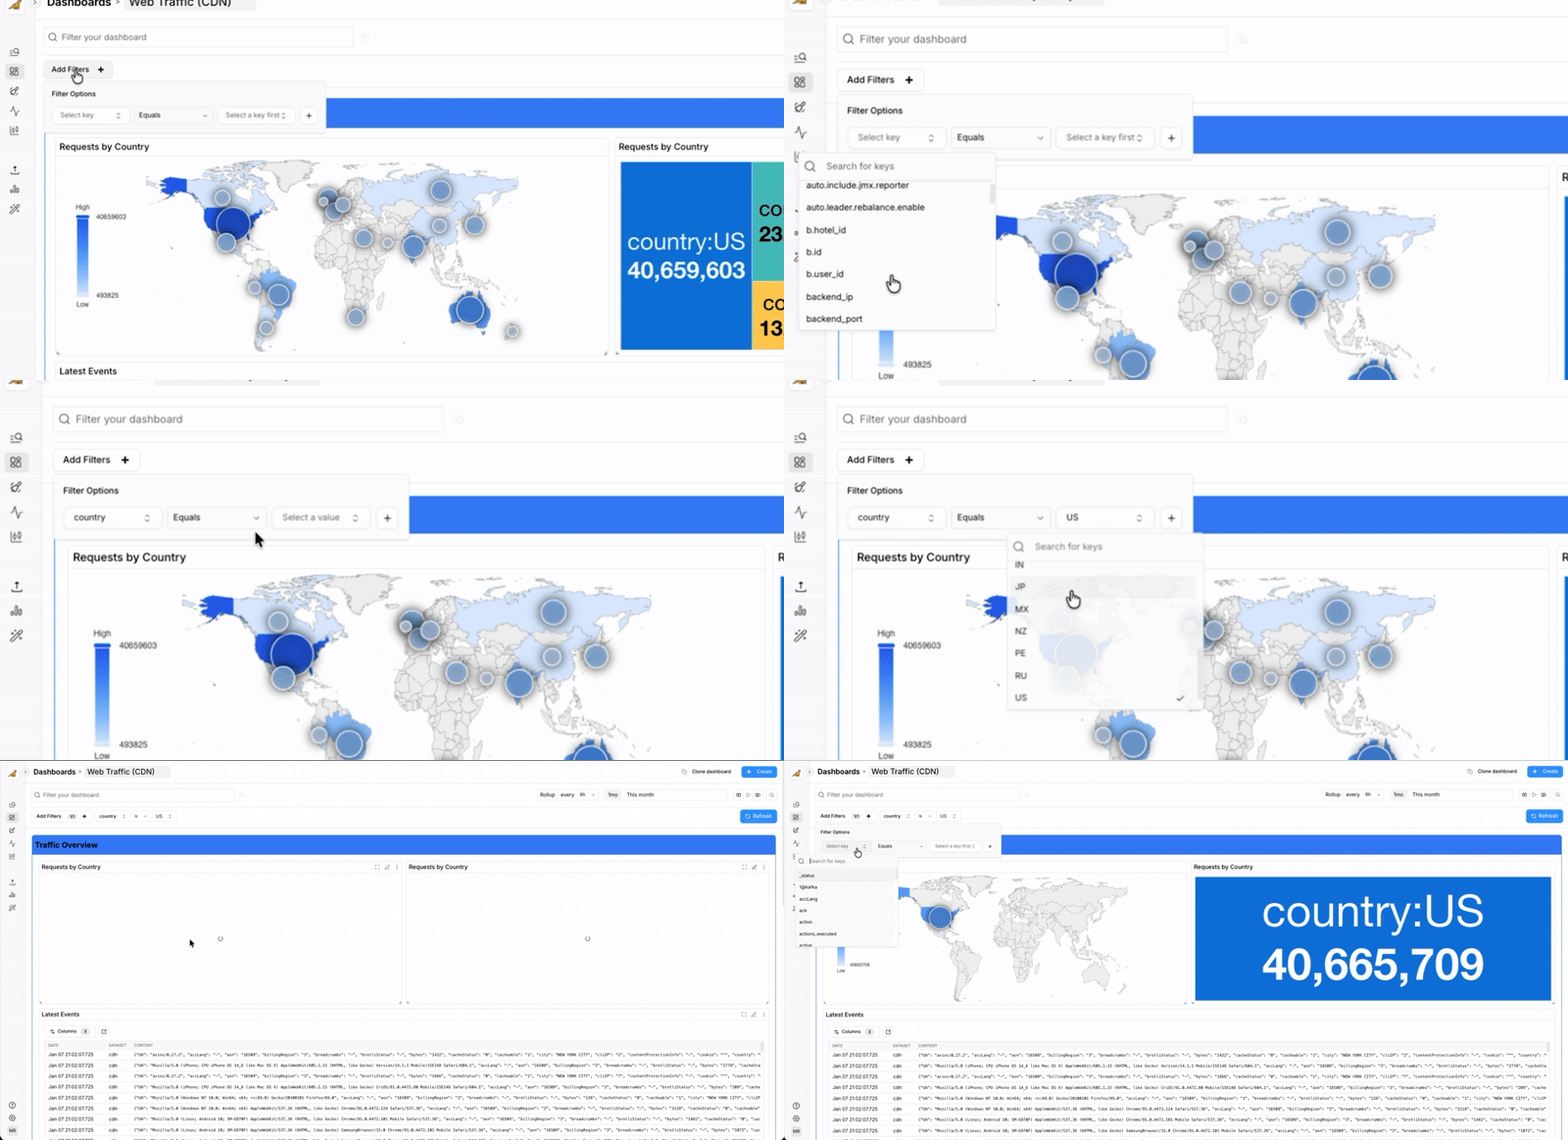
- Use the query builder with a searchable dropdown list of top keys and values
- Or write SQL filters directly in the filter bar
The power of filtering, at scale
In many logging or observability tools, you might have to update a filter on every single chart, table, or widget across a dashboard. This is tedious and a massive time-sink.
With Bronto, when I apply a filter in the main query bar, it instantaneously updates every single widget on the dashboard for your given timeframe. With a standard retention period of one year, you don’t need to worry about missing long-term trends, all your data is fully searchable and visualisable. Concerned about when an issue started? No problem: you can analyse trends over large timeframes, in months rather than days.
Our widgets use pre-computed LBMs (log based metrics) for rapid responses, but we have recently updated our dashboards to be able to run queries to further filter the data in your dashboard. This filtering is rapid, as it benefits from the speed and performance of our logging platform, so you will get results in seconds and can drill down across all widgets at the same time using a search language you are familiar with, or take the easy way and click from the drop down list of top keys and values.
You might notice that I did not reference any initial configuration of keys I want to filter in the dashboard - I can use any key I want in the filter.
Log Based Filtering vs Log Based Metrics
Log-based metrics (LBMs) shine when it comes to speed, delivering millisecond responses that power real-time dashboards, trend analysis, and high-level views of system behavior. When something unexpected happens or you get a specific request from your team we seamlessly switch from metrics to log based filtering so you can investigate deeper issues, explore raw data, and uncover answers without being constrained by pre-defined fields or aggregations.
Log based filtering excels because it lets you query and visualise raw logs immediately, without requiring upfront configuration such as index definitions or field extraction. We combine this with structured parsing and indexing, using the right approach for the right job. This hybrid model delivers both fast, flexible investigation and high-performance queries on known fields without forcing users to predefine every key or build parsing pipelines before they can search effectively.
Bronto lets you filter on anything in your logs, instantly. No waiting for indexing, no schemas to define or limits on how complex your query can be. You have complete freedom to query and visualise the data you need for the reports you need, when you need them most.
How I use dashboard filtering to understand customer usage
My primary internal use for this feature is to gather and present product usage and product engagement data to our leadership team. For example, I often need to answer questions like: "How much data did Org ID 54321 send over the last 6 months?" or "How much did company ACME search last month?"
Instead of building 10 custom dashboards which doesn't scale when you customer base is growing rapidly, or clicking around a complex UI, I simply use our dashboard filtering:
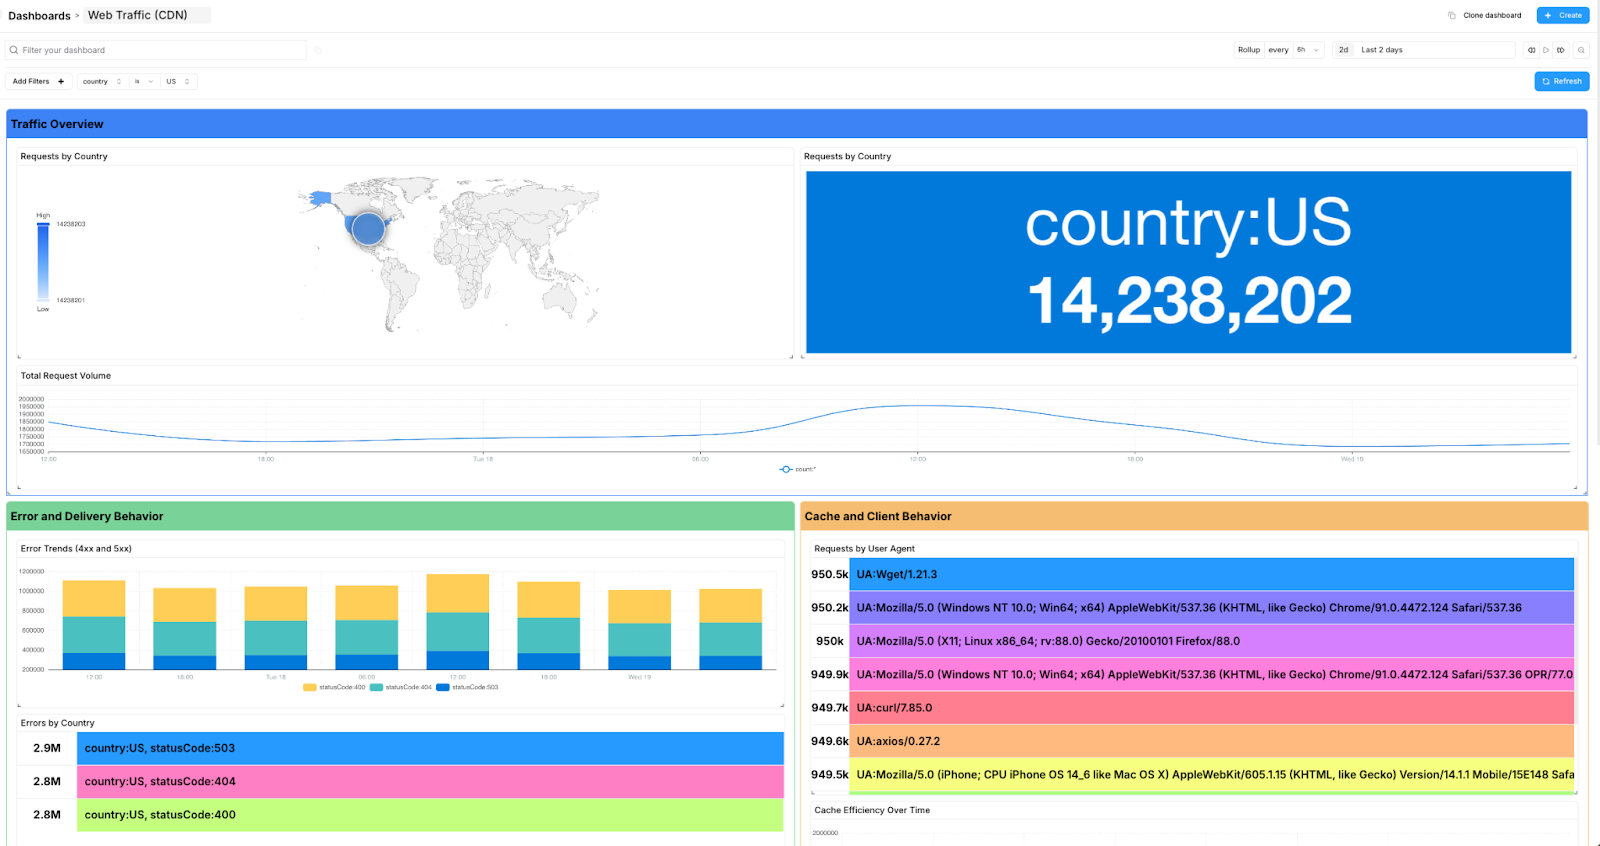
- Navigate to our main Usage Dashboard.
- Enter any key of interest in your SQL filter for your use case. For customer usage, I enter the specific org_id in the main query filter (e.g., org_id: 54321)
- Every widget updates instantly to reflect only the data for that organization.
This simple action turns a complex, multi-step data lookup into a quick and easy process, allowing me to provide accurate reports and summaries for leadership and other internal stakeholders for review.
The first time I tried filtering across the dashboard for an org_id I thought something was not quite right with how fast the results were rendered, given I was looking over TBs of data. It was a “wow” moment. As a customer support lead, it makes me happy to see how all of the under the hood changes that we are adding for our customers really improves their everyday use of our product (and mine!) and helps them to get answers to their questions faster.
Comparing our dashboards to the competition
Most dashboard tools are optimized for known questions: predefined fields, fixed widgets, and metrics you decide on ahead of time. That works well for stable monitoring, but it breaks down when you need to explore new questions, investigate unexpected behavior, or quickly slice data in different ways.
Bronto’s dashboards are designed to stay flexible under change. By combining fast log-based metrics with instant, dashboard-wide filtering on raw log data, you can start with a high-level view and progressively narrow in without reconfiguring widgets, rebuilding dashboards, or waiting for results to render. This approach reduces setup overhead and keeps dashboards useful during real-world debugging, analysis, and reporting, where the right question often isn’t known in advance.
Summary
Modern teams need dashboards that are fast, flexible, and easy to adapt as the questions you need to answer change. In this post, we walk through how Bronto dashboards combine high-performance log-based metrics with instant, dashboard-wide filtering to help you explore usage, investigate issues, answer leadership questions, and quickly re-run reports as requirements evolve. Using real customer usage examples, we show how filtering turns dashboards into an interactive investigation tool without upfront schemas, reconfiguration, or slow refresh cycles, so questions like “what does usage look like over the last six months?” are answered in seconds.


