Investigation Reports: When Monitors Get Smarter
Marco Aquilanti
Typically, when a monitor fires, there are a sequence of checks required to find the root cause. The engineers who set up the monitor usually know these steps by heart – they know the dependencies, the error codes, what to check and where. However, for the on-call responder, these steps aren't always obvious. Historically, the solution was to "force" engineering teams to document these checks in a playbook hoping that the responder would read them while under pressure from a potential outage.
Today, we can offload these checks to an LLM, shifting the responder's role from gathering evidence to reviewing a diagnosis, significantly reducing the Mean Time to Resolution (MTTR).
Ournew Investigation Reports feature reduces the manual toil of alerts response. An LLM can complete an investigation and provide a detailed report before the human even reaches their keyboard or acknowledges the alert.
Investigation reports follows BrontoScope, our first AI-powered investigation feature that combines the LLM decision-making capabilities with our search engine's subsecond performance.
Building on the positive customer feedback we received about BrontoScope, we realised there was an opportunity to do something similar with autonomous investigation around monitoring.
BrontoScope vs Investigation Reports
BrontoScope and Investigation Reports both perform automated investigations and provide reports but they work in very different ways.
BrontoScope starts with a user request to investigate a specific error event present in the logs. The investigation follows defined steps, in a coded workflow, with the aim of defining when and where the error is occurring. The LLM guides the process and summarises the findings in a report delivered synchronously to the user that is waiting for a response.
Investigating an alert is a much more generic task compared to BrontoScope, and it is harder to define a workflow that succeeds in any scenario. On the positive side, the alert investigation is triggered by a system event (the monitor firing) and there is no user waiting for a synchronous response, so the LLM has more time (not seconds but minutes) to query the data and analyse the results.
For these reasons, in Investigation reports, we let the LLM operate freely; providing it with tools and context.
Tools Are Easy, Context Is Hard
The tools part is straightforward, the LLM can use our APIs to take advantage of lightning-fast search, key-value dictionaries, monitor history, precomputed metrics, and more.
Context is more challenging, so let's explain how we solve it for Investigation Reports.
LLMs are good at making logical decisions when provided with relevant and well-explained context. The LLM context window is limited and, even if new models accept more tokens as input, it has been proven multiple times that longer context leads to worse answers and higher hallucination rates. This problem is known as "context rot" and represents one of the main limitations of today's models (Ref: https://research.trychroma.com/context-rot, https://arxiv.org/pdf/2509.21361).
For an investigation to be effective, an LLM needs more than which monitor has triggered; it requires historical context, an understanding of the monitored system. However, dumping thousands of tokens of documentation into the prompt backfires. Excessive data drastically increases the risk of hallucinations and degrades the accuracy of the report.
User-Defined Investigation Context
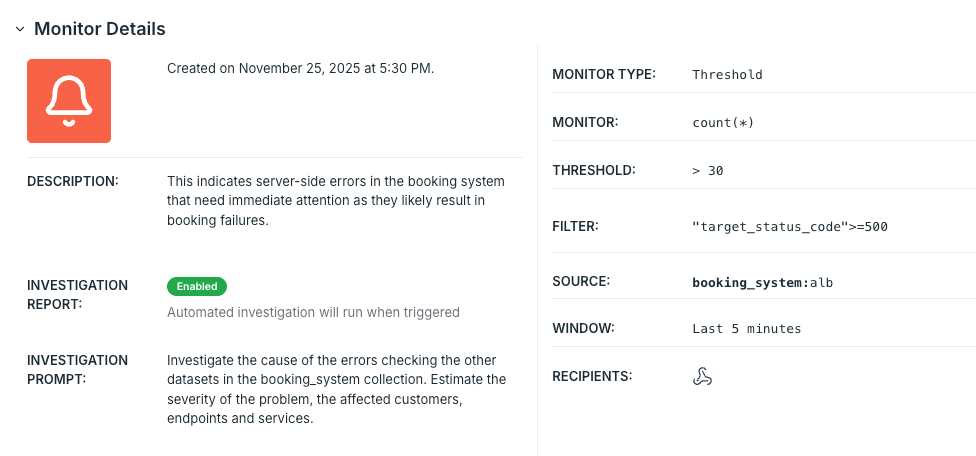
The precise knowledge required by Investigation Reports is hard to infer for an LLM autonomously, but it can be provided by the user who owns the monitor. In a dedicated text area (labelled as "Investigation Prompt" in the following screenshot), the user instructs the LLM on what to check and what to do when the monitor fires.
Providing free text description makes the feature highly flexible and allows users to adapt the investigation to different scenarios, effectively defining an ad-hoc workflow crafted for a specific use case.
For instance, engineers and SREs are using Investigation Reports mainly to investigate system errors. The most common instructions for this scenario include:
- List of dependencies of the affected service
- Related logs and how to correlate/query them
- Relevant keys and metrics to check
- What to include in the report, like affected components, customers or users
The example prompt shown in the screenshot below provides context by telling the LLM to check datasets (logs) in the collection named booking system.
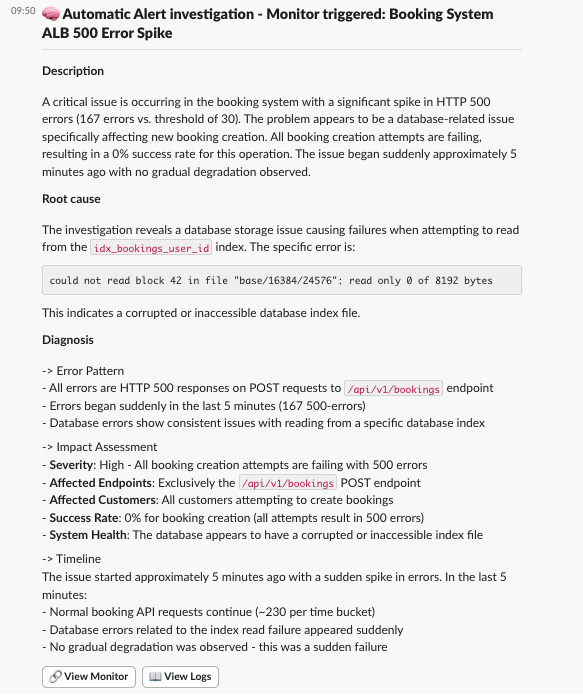
The following screenshot shows the Investigation Report generated when the monitor above fired. The LLM has followed the instructions, made multiple queries and wrote a report which includes a potential root cause, diagnosis and a timeline of the issue.
Investigation Reports Beyond Incident Response
The Bronto customer support and sales team found a different use case for Investigation Reports. They set up Bronto monitors to be notified if new organizations are created or contracts are updated in the system. These notifications allow the teams to be up to date on new sign-ups and onboarding of new customers/POCs. Investigation reports automates the task of fetching the context regarding the event.
Data like the type of contract, the retention, the plan, the company size, the location etc are fetched by the LLM, querying multiple logs. The report is sent as a follow up message within a minute of the monitor notification triggering and allows the team to quickly spot relevant events over routine ones.
Below the investigation prompt as configured by the customer support team and an example of the related report automatically generated.


This blog has given examples of how Investigation Reports are a great way of taking advantage of the current capabilities of LLMs. These reports allow every monitor notification to come with relevant information to speed up the resolution of every incident. We will be building further on this capability with new features in the coming months, using AI in conjunction with our powerful logging platform to assist users to reduce toil, resolve issues and perform analysis of their data.
Try Bronto free for 14 days
Centralize your agent and infrastructure telemetry in one platform with sub-second search and 12-month hot retention. No credit card required.